Installing the TICK Stack Tools to Collect Metrics
The TICK Stack is a great platform if you want to gain some visibility over your applications. However, looking into how to install it can be a little overwhelming. There are four tools that you need to install to use it:
- Telegraf to collect the data
- InfluxDB to store the data
- Chronograf, the UI to view the data
- Kapacitor to process the data in real time
All these tools are documented individually, with instructions on how to install them. But I wanted to have simple instructions to install all of them in Ubuntu and get started quickly.
Installing the Tools
First, add the InfluxData repository to your machine
curl -sL https://repos.influxdata.com/influxdb.key | sudo apt-key add -
source /etc/lsb-release
echo "deb https://repos.influxdata.com/${DISTRIB_ID,,} ${DISTRIB_CODENAME} stable" | sudo tee /etc/apt/sources.list.d/influxdb.list
Then install the applications
sudo apt-get update && sudo apt-get install influxdb telegraf chronograf kapacitor
To configure Telegraf, edit the file /etc/telegraf/telegraf.conf and uncomment the [[inputs.statsd]] section.
Inside the statsd section, uncomment the templates and add the templates you need. You can find more information on the format of the templates in the Telegraf documentation.
templates = [
 "cpu.* measurement*",
 "blog.views.* measurement.measurement.page.field"
]
Now make sure all the needed service are started.
sudo service influxdb restart
sudo service telegraf restart
sudo service chronograf restart
sudo service kapacitor restart
Configure the UI
Chronograf is installed, and listening on port 8888. I installed in in a PuPHPet VM, so mine is available at http://192.168.56.101:8888.
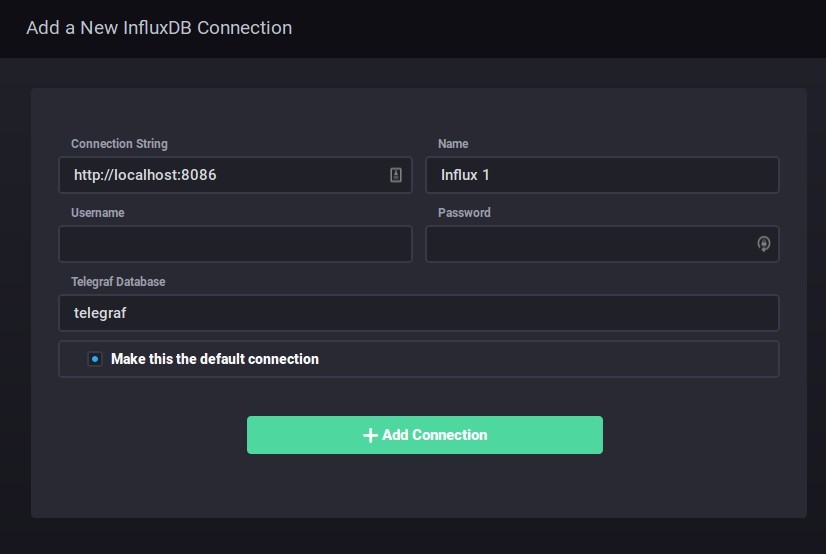
You can leave all the default values and click on Add connection.
Next, you will need to configure Kapacitor. Click on Configuration in the left toolbar.
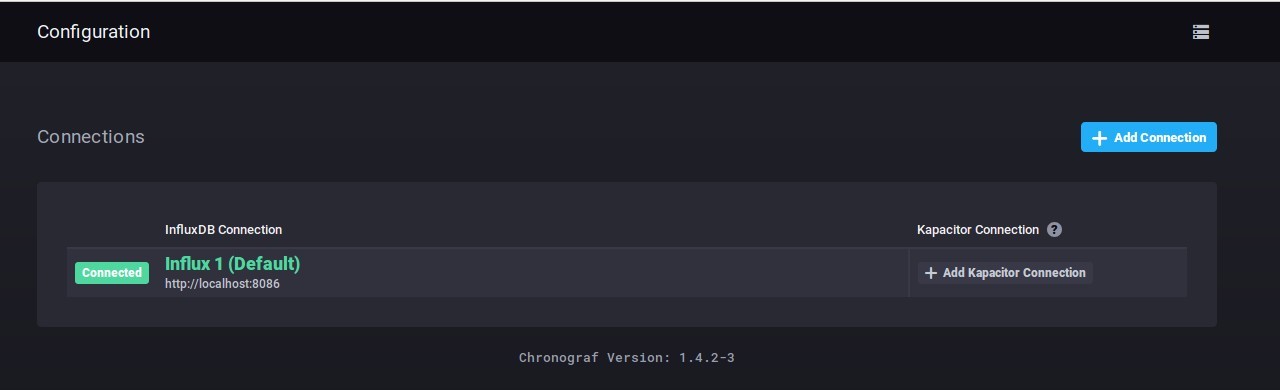
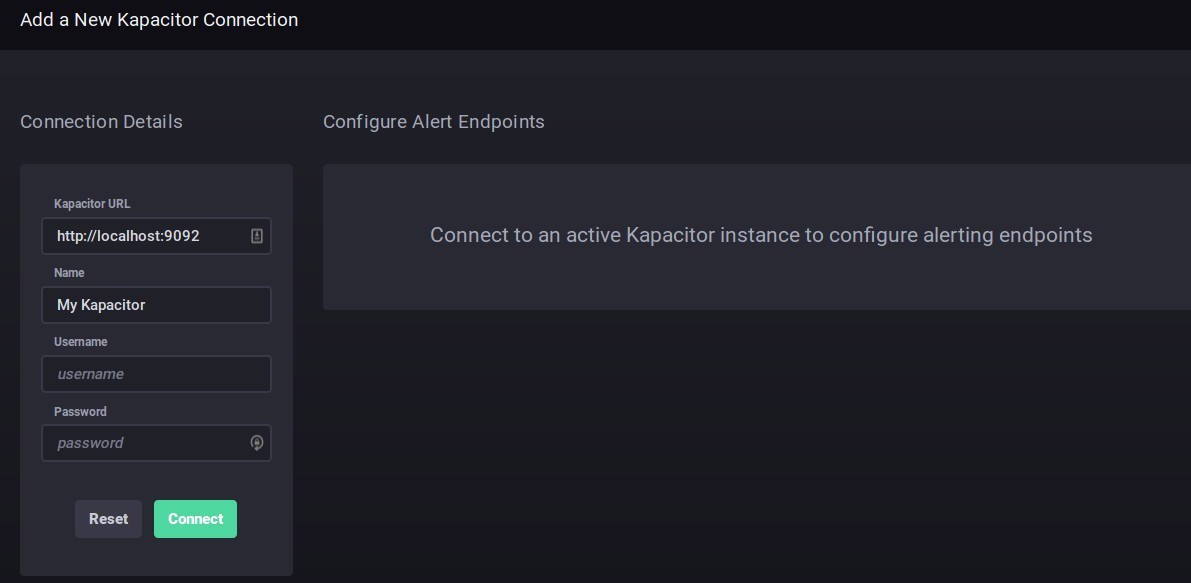
Click on Add Kapacitor Connection in the Configuration page, leave all the Kapacitor settings to their defaults and click on Connect.
Test The Applications
Log data to the template you created earlier.
echo "blog.views.home.pageview:1|c" | nc -w 1 -u 127.0.0.1 8125
Check in the database for the data you inserted.
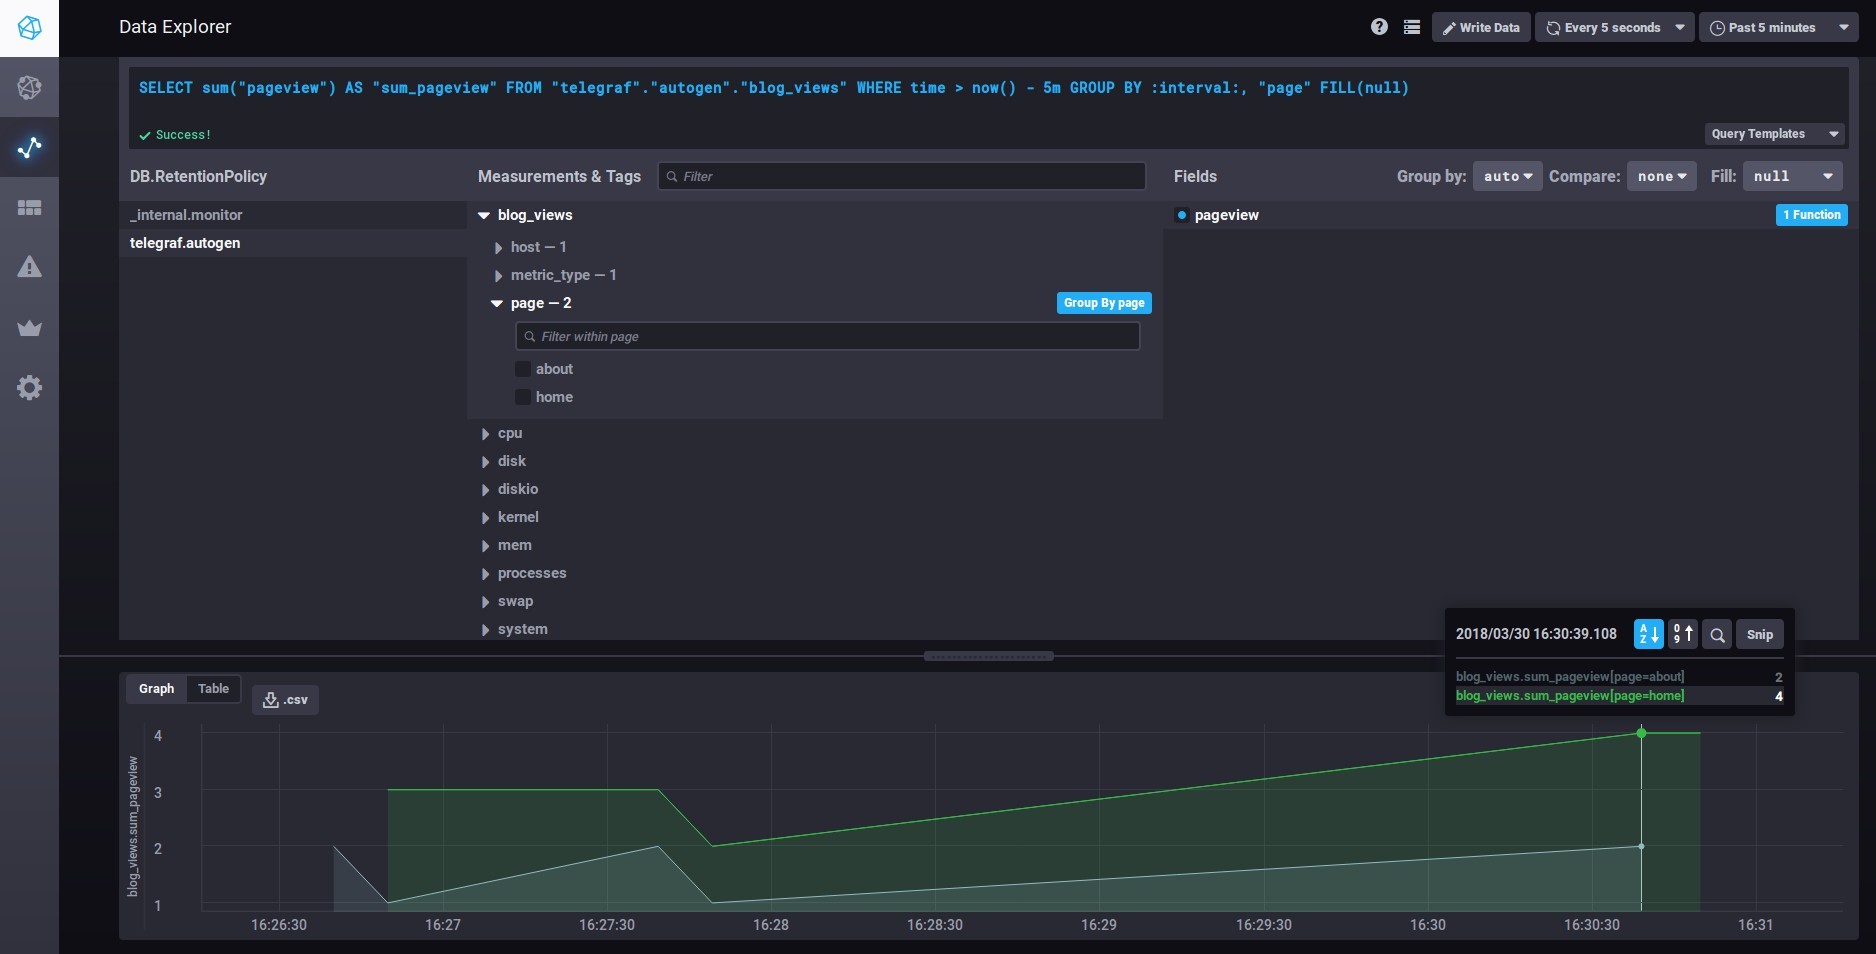
$ influx
Connected to http://localhost:8086 version 1.5.1
InfluxDB shell version: 1.5.1
> use telegraf
Using database telegraf
> select * from blog_views
name: blog_views
time host metric_type page pageview
---- ---- ----------- ---- --------
1522440310000000000 machine1 counter home 2 1522440320000000000 machine1 counter home 1

You should also be able to see the inserted data in Chronograf.

Click on Data Explorer in the left side menu. Choose telegraf.autogen DB, and explore your data.