Continuous Integration In PHP
According to Wikipedia, continuous integration
implements continuous processes of applying quality control — small pieces of effort, applied frequently.
In simple terms, you verify that your project meets the quality standards frequently. This way, you can catch any deviation early. Doing the integration in small increments makes it easier. Implementing a continuous integration server can look difficult when you’ve never done it. In this post I will try to document how to set it up. I take for granted that you already have a LAMP server configured.
The Tools
PHP has many tools that can be used to analyse your code. There are tools for running unit tests, detecting copy/paste, checking the coding standards and more. We have to thank Sebastian Bergmann for this because he wrote most of those tools. I’ll cover some of them here, but there are more.
PHPUnit
PHPUnit is the PHP version of the xUnit framework. It allows running automated tests on code. To install it, use those commands:
sudo apt-get install php5-curl php-pear php5-dev
sudo pear upgrade pear`

sudo pear channel-discover pear.phpunit.de
sudo pear channel-discover components.ez.no
sudo pear channel-discover pear.symfony-project.com

sudo pear install phpunit/PHPUnit
After you installed PHPUnit, you can run it with this command:
phpunit .
It will look for test cases in the current folder and sub folders.
You can also use PHPUnit to generate a code coverage report.
phpunit --coverage-html ../CodeCoverage .
This will generate an HTML report of the code that is covered by the tests. The files will be located in the path you passed it. In this case, a CodeCoverage folder located in the parent folder. The reports will look like this:

If you click on a file, you will get the coverage by function and the content of the file. The code will be highlighted to show what is covered and what is not.


PHP CodeSniffer
PHP Code Sniffer analyse you code and detect violations to coding standards. It comes bundle with a few standards like the Zend and PEAR standards. But you can write your own standard by expanding an existing standard.
It’s a simple PEAR install. Than you can run it by calling phpcs with the standard to use and the path to check.
sudo pear install PHP_CodeSniffer
phpcs --standard=Zend .
You will get a result like this:

If you don’t want to specify the standard to use on every call, you can set a default with:
phpcs --config-set default_standard Zend
PHP Depend
PHP Depend is a tool that will perform a static analysis of you code base. It generates software metrics that can be used to evaluate the complexity and quality of your code. Install it with PEAR:
sudo pear channel-discover pear.pdepend.org
sudo pear install pdepend/PHP_Depend-beta
To execute it, you call pdepend and pass it the type of reports you want it to generate. Execute it without parameters to view a brief description of the possible parameters.
pdepend --jdepend-xml=../jdepend.xml --jdepend-chart=../dependencies.svg --overview-pyramid=../overview-pyramid.svg .
This will generate an XML with the packages dependencies, a diagram of the dependencies and the overview pyramid of the project.

The Abstraction Instability Chart was invented by Robert C. Martin (uncle Bob) as a mean of measuring the instability and abstraction of the packages of a project. You should try to keep your packages as close as possible to the green line. An abstract package should have more classes depending on it, so it should be very stable. Concrete packages can be unstable, because nothing should directly depends on them if you code against abstractions. Having said that, I am not sure how it breaks my code into packages. I would guess it uses folders.

The Overview Pyramid contains the metrics extracted by PHP Depend. The PHP Depend documentation has a great explanation of the pyramid, but I’ll try to give a brief overview.
The top part displays the metrics about inheritance. They are Average Number of Derived Classes (ANDC) and Average Hierarchy Height (AHH). ANDC tells you how many of your classes are derived from other classes. AHH is a measure of how deep your hierarchy is.
The bottom right part shows the coupling metrics. NOM represents the numbers of methods in your project. CALLS is the number of methods calls. FANOUT counts the types that are references by your classes. It counts only references that are not part of the same class hierarchy.
The bottom left part of the pyramid contains the metrics that are used the most. NOP is the number of packages, NOC the number of classes, NOM the number of methods, LOC the lines of code and CYCLO is the cyclomatic complexity.
The numbers in the middle represents the actual count and the numbers on either sides are averages of the metrics. They represent the value of the row under it divided by the value of the current row. So in my graph, I have a total of 168 lines of code and 26 methods, for an average of 6.462 lines per method.
PHP Mess Detector
PHPMD is used to detect problems in your code. It uses the same metrics as PHP Depends to give you feedback on your code. It can detect possible bugs and common issues. Install it with PEAR.
sudo pear channel-discover pear.phpmd.org
sudo pear channel-discover pear.pdepend.org
sudo pear install --alldeps phpmd/PHP_PMD
To execute PHPMD you need to give it the files to parse, a format for the output and the rule sets to use.
phpmd . html codesize,unusedcode,naming,design --reportfile ../messdetector.html --exclude Tests/
This will run it on the current folder and generate html. It will use all 4 rule sets install with PHPMD. The reportfile option tells PHPMD to send the output to the specified file instead of stdout and the exclude options tells it to ignore files in the Tests folder. It generates something like this:

PHP Copy/Paste Detector
As the name implies, PHPCPD detects when code has been copied over in your code. This gives you great candidates for refactoring your code.
Install it with PEAR. If you already installed PHPUnit, you should not need the two channel-discover commands.
sudo pear channel-discover pear.phpunit.de
sudo pear channel-discover components.ez.no`
sudo pear install phpunit/phpcpd
When it’s installed you can just run phpcpd by giving it the path to check. It will returns something like this:

PHP Dead Code Detector
PHPDCD scan you project and detect functions that are not called. This might not look like a big deal, but dead code can really slow down the maintenance of a project. Developers have to scan and understand this code, and they might end up fixing bugs in code that is never called. Delete this code, you can get it back from your source control if you need it.
sudo pear channel-discover pear.phpunit.de
sudo pear channel-discover components.ez.no`
sudo pear install phpunit/phpdcd-beta
Run it by calling phpdcd with the path to scan. I make it ignore my tests. If not, it will flag them all because they are not called anywhere in the code, phpunit runs them.

Putting It All Together With Jenkins
All those tools are very good, but having to call them one by one is painful. Jenkins is the continuous integration server that will manage continuously running all of those tools. It will be a central point of access for all the reports and send notifications when a build failed.
Building Your Project
Jenkins can build a project in many ways. It can use a Windows batch file, execute a shell script, Ant or Maven build files.
For my project I used Ant. To install Ant, make sure you have the Java JDK installed, then you can install it with apt.
sudo apt-get install default-jdk
sudo apt-get install ant
Then, you need to create your build file. The Ant site has a great introduction on creating build files. Here’s what my build file looks like:
<project name="Test" default="build" basedir=".">
	<property name="output" location="${basedir}/buildOutput/"/>

	<target name="init">
		<mkdir dir="${output}"/>
		<mkdir dir="${output}/phpcs/"/>
		<mkdir dir="${output}/pdepend/"/>
	</target>

	<target name="build" depends="init, test, phpcs, phpmd, phpcpd, pdepend">
	</target>

	<target name="test">
		<exec executable="phpunit" failonerror="true">
			<arg line="--coverage-clover ${output}/CodeCoverage/clover.xml
				--coverage-html ${output}/CodeCoverage/
				."/>
		</exec>
	</target>

	<target name="phpcs">
		<exec executable="phpcs">
			<arg line="--report=checkstyle
              			--report-file=${output}/phpcs/checkstyle.xml
              			--standard=Zend
              			${basedir}" />
		</exec>
	</target>

	<target name="phpmd">
		<exec executable="phpmd">
			<arg line="
				 . xml codesize,unusedcode,naming,design --reportfile ${output}/messdetector.xml --exclude Tests/
			" />
		</exec>
	</target>

	<target name="phpcpd">
		<exec executable="phpcpd">
			<arg line="
				 --log-pmd ${output}/phpcpd.xml .
			" />
		</exec>
	</target>

	<target name="pdepend">
		<exec executable="pdepend">
			<arg line="
				--jdepend-xml=${output}/pdepend/jdepend.xml
				--jdepend-chart=${output}/pdepend/dependencies.svg
				--overview-pyramid=${output}/pdepend/overview-pyramid.svg
				--ignore=Tests/
				.
			" />
		</exec>
	</target>
</project>
It defines a default target that make sure the needed folders for the output are there, then it calls PHPUnit, PHP Code Sniffer, PHP Mess detector, PHP Copy Paste Detector and PHP Depend.
Installing Jenkins
Installing it it pretty easy. There are package for many OS. For Ubuntu, just follow the instructions from the Jenkins site. Download the key and add it to apt.
wget -q -O - http://pkg.jenkins-ci.org/debian/jenkins-ci.org.key | sudo apt-key add -
Add this line to /etc/apt/sources.list
deb http://pkg.jenkins-ci.org/debian binary/
Update your apt index and install Jenkins
sudo apt-get update
sudo apt-get install jenkins
This will install Jenkins, set it as a daemon and start it. After, you can navigate to http://localhost:8080 to access your Jenkins installation.

Configuring Jenkins
Jenkins has many configuration options. I won’t go through all of them, but I’ll try to cover those I thinks are important. First click on “Manage Jenkins” then “Configure System”. Go through the settings there and configure Jenkins according to your needs. You should probably enable the security and pick how your users will log in. You should also configure the SMTP servers so Jenkins can send you emails.
After, look at the plugins and enable those you need. I use Git for my source control, so I enabled the Git plugin. All I needed to do was select the plugin, click on the Install button at the bottom of the list and click on the restart button when it was done.
You will also need a bunch of plugins to manage the data produced by the tools. Clover will display a code coverage graph from with the data built by PHPUnit. Checkstyle to display the results of PHP Code Sniffer. PMD for the PHP Mess Detector results. DRY to show duplicated code. And finally JDepend to show the metrics produces by PHP Depend.
Creating You Project
This is where you will configure Jenkins to build your project. Click on the “New Job” link. Give your job a name, select the free style project and click on OK. You will be taken the Configure page of the project. There are many options available and they all have a description if you click on the question mark icon.
First thing I did is a trick I got from Sebastian Bergmann’s Template for Jenkins Jobs for PHP Projects. I added an embed tags with links to the svg files created by PHP Depend. Since they are not showed by the plugins and they contains valuable information, it’s nice to see them on my project page.
Next, I needed to configure the source control repository. I gave Jenkins the path to my Git repository on the same machine. I left the branch blank so it check for changes in all the branches and build them. I entered the URL to my Gitweb interface so my builds can contains links to the repository and the commit that triggered the build.
Git requires that you set a user name and an email. The advanced section of the Git repository setup have fields for them, but they are not saved correctly, so you will have to do it manually.
su - jenkins
git config --global user.name "Jenkins"
git config --global user.email "jenkins@yourdomain.com"
This problem should be fixed in the next version.
You needs to tell Jenkins when to build your project. I decided to have Jenkins poll Git every minutes and launch a build every time something changed. I your project has many commits and takes time to build, you might want to make interval between checks longer.
In the build section, I just told Jenkins to invoke Ant. Since I want it to launch the default action in my build file, I did not need to give it a target.
Post Build Actions
This is where most of the configuration for the project is needed. All the plugins we installed for displaying the results of the build need to be configured. Make sure, you select all the plugins you have installed.
Many plugins will requires a results file. This is the files produce by the tests tools. Enter the relative path the results files so Jenkins can read them. There are also “Run always” check-boxes. By default, some plugins don’t run on failed build. When “Run always” is checked, the plugin will run no matter the status of the build.
Some plugins also requires some thresholds. Those are the values that tell Jenkins when to consider a build unstable, or failed. Configure them to values that make sense for your project. For the code coverage, set the conditionals to 0%, because they are not reported.
At the bottom of the project settings, you can also configure Jenkins to send emails on failed build. It will ask you for a list of addresses where to send the email and you can make it send another email to those who break the build.

The End Result
Keep Jenkins running for a while. Work on your project and make a few commits. After some time, you will have a project page that looks like this:

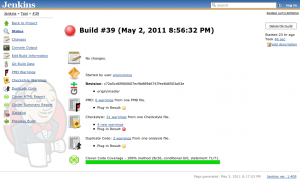
If you click on a build in the Build History, you will get a page like this one:
If you have a team that commit early and often, Jenkins will provide some invaluable information. You can use it to look for part of your code where you need improvements. You can always know if your new developer is not following the team coding standards. And you can pinpoint area that might be too complicated and should be refactored. With a good test suite in place that automatically runs on every commit, you can detect regressions as soon as they are committed.
Wrapping It Up
The subject of Continuous Integration is broad and this is already a long post. And there is still much I need to learn about it. Creating the build script and configuring the Jenkins project was a lot of work. It was fun to do and I learned a lot, but doing it manually for every project would be daunting. I already mentioned it earlier, there is a great template job for Jenkins. It has all the instruction for installing it, a build script and the Jenkins project.