Profiling a PHP Application
When developing web applications, we often run into performance issues. People often blame PHP or MySQL for bad performance, but in most case the answer is not that easy. Blindly trying to optimize random parts of our applications can lead to some uneven results.
There are many available tools to profile a PHP application. Learning how to use them can help us pinpoint which parts are slow. With this information we can pick the optimizations that will give us the best results.
This post describes the installation and configuration of some of them. I tested them in a Ubuntu 10.10 virtual machine. If you want to try those tools, don’t forget that they can greatly impact the performance of you web server when they are active. Installing a tool like Xdebug on a production server is not recommended.
Benchmark Your Application
First you need to benchmark your application. If you don’t, you won’t be able to know if you improve the performance or degrade it. If you make some changes, a gut feeling that the site is faster is not enough, you need to have numbers. Siege is a load testing tool. It will tell you how many request a second your application handle and the response time.
Installing Siege is pretty straightforward, download it, untar it and compile it with make.
tar -xvf siege-latest.tar.gz
cd siege-2.70/
./configure
make
sudo make install
siege.config
Running siege.config will generate a .siegerc file. You might need to edit it and change where the log file is generated. By default, the logs where stored in /var/siege.log and I didn’t want to run it as root. So I uncommented the logfile line to store it in my home folder. You might want to set verbose to false also.
When Siege is install, you can use the following command to execute it for 30 seconds with 5 concurrent connections.
siege -c 5 -b -t30s http://localhost
** SIEGE 2.70
** Preparing 5 concurrent users for battle.
The server is now under siege...
Lifting the server siege.. done.
Transactions: 143 hits
Availability: 100.00 %
Elapsed time: 29.75 secs
Data transferred: 0.27 MB
Response time: 1.02 secs
Transaction rate: 4.81 trans/sec
Throughput: 0.01 MB/sec
Concurrency: 4.92
Successful transactions: 143
Failed transactions: 0
Longest transaction: 1.54
Shortest transaction: 0.94
The results will be appended to the log file. This makes it easy to compare the numbers after you make some changes. You can also see when the performances really start to degrade if you add users.
Xdebug
Xdebug is a debugger for PHP. I already talked about it in my post on Debugging PHP In Eclipse. It can also be used for profiling. You can install it with Apt.
sudo apt-get install php5-xdebug
To configure it, open the Xdebug ini file, on standard Ubuntu it’s in ‘/etc/php5/conf.d/xdebug.ini’. Add these lines:
xdebug.default_enable=1
xdebug.scream=1
xdebug.profiler_enable=1
xdebug.profiler_output_dir=/tmp/xdebug
This will make sure that Xdebug append a stacktrace to errors. And the scream option will disable the PHP error control operator (@). This way all errors will be displayed. It enable the profiler and change it’s output folder. Make sure the folder exits and that apache can write in it.
When Xdebug is installed and configured, restart Apache and browse to your web application. Xdebug will create some files in the folder you picked. You can then use KCachegrind to view those files. You can install it with this command:
sudo apt-get install kcachegrind
On a Gnome machine, this will install lots of dependencies. But after, you will be able to open the output file from Xdebug. You should get a window that looks like this:

In KCachegrind you can see where your program spent most of it’s time. How many time a function is called. This information should help identify where you should start optimizing to get the most out of your time.
If you prefer a web front end, you can use Webgrind to inspect the result of Xdebug.
XHProf
Xdebug is a very good tool to check where your bottlenecks are in development. However, you should not use it in production. Facebook developed XHProf a profiling tool that can be used on a production server.
To install it, download the latest version and run those commands:
tar -xvf xhprof-0.9.2.tgz
cd xhprof-0.9.2/extension/
phpize
./configure --with-php-config=/usr/bin/php-config5
make
make test
sudo make install
Edit your php.ini and add those line at the end:
[xhprof]
extension=xhprof.so
;
; directory used by default implementation of the iXHProfRuns
; interface (namely, the XHProfRuns_Default class) for storing
; XHProf runs.
;
xhprof.output_dir=/tmp/xhprof
Make sure to change the output dir to something appropriate on your machine.
To profile your application, you now need to add some code at the beginning and at the end of you page execution. Add this at the beginning:
xhprof_enable();
And this at the end:
$data = xhprof_disable();

$XHPROF_ROOT = '/home/testing/Downloads/xhprof-0.9.2';
include_once $XHPROF_ROOT . "/xhprof_lib/utils/xhprof_lib.php";
include_once $XHPROF_ROOT . "/xhprof_lib/utils/xhprof_runs.php";

$xhprof_runs = new XHProfRuns_Default();

// Save the run under a namespace "xhprof".
$run_id = $xhprof_runs->save_run($data, "xhprof");
XHGui
XHGui is a tool that allow saving the data from XHProf in a database and displaying it in a nice UI. It also comes with two files that facilitates adding XHProf to your silte. To install it, clone the repository from GitHub. And follow the instructions in the INSTALL file. Here are the instructions for a machine using MySQL for storage.
git clone https://github.com/preinheimer/xhprof.git
cd xhprof
ln -s xhprof_lib/utils/xhprof_runs_mysql.php xhprof_runs.php
mv xhprof_lib/config.sample.php xhprof_lib/config.php
Look in the xhprof_runs.php file. There is a create table query. Create a database for XHGui and execute the query. Edit the file xhprof_lib/config.php and enter the information for your system. Don’t forget to set doprofile to true. Also, you need to uncomment one of the section for the paths where XHGui should put its files. There are default values for Windows and Linux.
XHGui comes with two files that makes profiling easier. A header file to start profiling and a footer that will end it and persist the information in your database. To automatically insert them in all your site, add the following lines to you virtual host:
php_admin_value auto_prepend_file "/home/testing/Downloads/xhprof/external/header.php"
php_admin_value auto_append_file "/home/testing/Downloads/xhprof/external/footer.php"
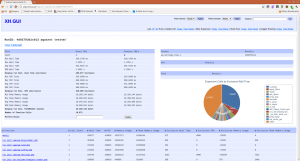
You will also need to create a virtual host for XHGui. Then after your site have been visited a few times, you can navigate to you XHGui installation and you will have a page that list the last 25 runs of your sites. Pick one and you should see a page like this one.
From this page you can view a lot of information about your pages. It contains statistics about the time the page took, the CPU and memory usage and the number of functions calls. At the bottom, there is a list of functions with the same information. It makes it easy for you to see where the page takes the most time or resources. This will help you find targets for optimizations that will really impact the use experience on your site or the machine where it runs. You can click on any function and view a break down of the functions it calls.
On the main page of a run and in the functions pages, you can generate a call graph with just on click.

It gives you a nice visual of the functions called when you display a page. The functions that can be problematics are in red or yellow, so you can spot the easily.
This Is Just The Beginning
This is only an introduction to some of the tools that are available for PHP developers. I want to play more with them, and maybe post more information when I get more familiar with them. If you don’t do any profiling, you should probably try them too.
One important rule when optimizing, always measure. Benchmark before and after every change to make sure you are going in the right direction.
Update 2011-04-01
| [php | architect](http://www.phparch.com/ “php | architect”) announced yesterday their first Annual Impact Awards. They nominated quite a few amazing projects, the choices are not easy. However, I think XDebug is an outstanding tool that impact the work of many PHP developers every day. Derick Rethans is doing some important work with it. He has my vote for the award. If you are a php | architect subscriber, go cast your vote. |